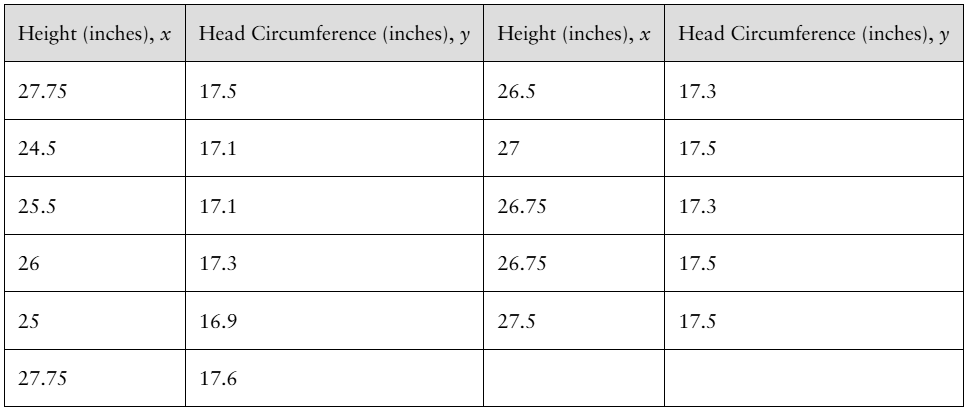
"[DATA] Height versus Head Circumference [See Problem 13 in Section 12.3] A pediatrician wants to determine the relation that may exist between a child’s height and head circumference. She randomly selects 11 children from her practice, measures their heights and head circumferences, and obtains the following data: b. Suppose the researcher wanted to determine if there is a positive association between height and head circumference. What would be the null and alternative hypotheses?"
Verified step by step guidance
1
Step 1: Identify the parameter of interest. Here, the pediatrician wants to determine if there is a positive association between height (x) and head circumference (y). This association is typically measured by the population correlation coefficient, denoted as \(\rho\).
Step 2: Formulate the null hypothesis (\(H_0\)). The null hypothesis usually states that there is no association or no positive association between the two variables. In terms of the correlation coefficient, this means \(H_0: \rho \leq 0\).
Step 3: Formulate the alternative hypothesis (\(H_a\)). Since the researcher wants to test if there is a positive association, the alternative hypothesis will be that the correlation coefficient is greater than zero: \(H_a: \rho > 0\).
Step 4: Understand the context of the hypotheses. The null hypothesis assumes no positive linear relationship or a negative/no correlation, while the alternative hypothesis assumes a positive linear relationship between height and head circumference.
Step 5: These hypotheses set the stage for a one-tailed test of correlation, where the test statistic will be calculated from the sample data to determine if there is sufficient evidence to reject the null hypothesis in favor of the alternative.
Verified video answer for a similar problem:
This video solution was recommended by our tutors as helpful for the problem above
Video duration:
1m
Play a video:
0 Comments
Key Concepts
Here are the essential concepts you must grasp in order to answer the question correctly.
Hypothesis Testing
Hypothesis testing is a statistical method used to decide whether there is enough evidence to reject a null hypothesis in favor of an alternative hypothesis. It involves formulating two opposing statements about a population parameter and using sample data to assess their validity.
The null hypothesis (H0) typically states that there is no effect or no association between variables, while the alternative hypothesis (Ha) suggests the presence of an effect or association. In this context, H0 would state no positive association between height and head circumference, and Ha would state a positive association.
Correlation measures the strength and direction of a linear relationship between two quantitative variables. A positive association means that as one variable increases, the other tends to increase as well. Understanding correlation helps in formulating hypotheses about relationships between variables.

 Verified step by step guidance
 05:52
05:52
