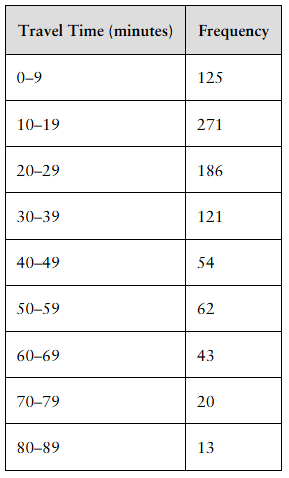
Household Winter Temperature Often, frequency distributions are reported using unequal class widths because the frequencies of some groups would otherwise be small or very large. Consider the following data, which represent the daytime household temperature the thermostat is set to when someone is home for a random sample of 750 households. Determine the class midpoint, if necessary, for each class and approximate the mean and standard deviation temperature.
Table of contents
- 1. Intro to Stats and Collecting Data1h 14m
- 2. Describing Data with Tables and Graphs1h 55m
- 3. Describing Data Numerically2h 5m
- 4. Probability2h 16m
- 5. Binomial Distribution & Discrete Random Variables3h 6m
- 6. Normal Distribution and Continuous Random Variables2h 11m
- 7. Sampling Distributions & Confidence Intervals: Mean3h 23m
- Sampling Distribution of the Sample Mean and Central Limit Theorem19m
- Distribution of Sample Mean - Excel23m
- Introduction to Confidence Intervals15m
- Confidence Intervals for Population Mean1h 18m
- Determining the Minimum Sample Size Required12m
- Finding Probabilities and T Critical Values - Excel28m
- Confidence Intervals for Population Means - Excel25m
- 8. Sampling Distributions & Confidence Intervals: Proportion1h 25m
- 9. Hypothesis Testing for One Sample3h 29m
- 10. Hypothesis Testing for Two Samples4h 50m
- Two Proportions1h 13m
- Two Proportions Hypothesis Test - Excel28m
- Two Means - Unknown, Unequal Variance1h 3m
- Two Means - Unknown Variances Hypothesis Test - Excel12m
- Two Means - Unknown, Equal Variance15m
- Two Means - Unknown, Equal Variances Hypothesis Test - Excel9m
- Two Means - Known Variance12m
- Two Means - Sigma Known Hypothesis Test - Excel21m
- Two Means - Matched Pairs (Dependent Samples)42m
- Matched Pairs Hypothesis Test - Excel12m
- 11. Correlation1h 24m
- 12. Regression1h 50m
- 13. Chi-Square Tests & Goodness of Fit2h 21m
- 14. ANOVA1h 57m
3. Describing Data Numerically
Standard Deviation
Problem 3.RE.6b
Textbook Question
Travel Time to Work The frequency distribution listed in the table represents the travel time to work (in minutes) for a random sample of 895 U.S. adults.

b. Approximate the standard deviation travel time to work for U.S. adults.
Verified step by step guidance1
Step 1: Determine the midpoint for each travel time interval. The midpoint is found by averaging the lower and upper bounds of each interval. For example, for the interval 0–9, the midpoint is \(\frac{0 + 9}{2} = 4.5\). Repeat this for all intervals.
Step 2: Multiply each midpoint by its corresponding frequency to find the total travel time contribution for each interval. This will help in calculating the mean travel time.
Step 3: Calculate the mean travel time \(\bar{x}\) using the formula:
\(\bar{x} = \frac{\sum (f_i \times x_i)}{n}\)
where \(f_i\) is the frequency for interval \(i\), \(x_i\) is the midpoint for interval \(i\), and \(n\) is the total number of observations (895 in this case).
Step 4: Calculate the squared deviation for each midpoint from the mean, i.e., \((x_i - \bar{x})^2\), then multiply each squared deviation by its corresponding frequency \(f_i\) to get \(f_i (x_i - \bar{x})^2\).
Step 5: Sum all the values from Step 4 and divide by the total number of observations minus 1 (i.e., \(n - 1\)) to find the sample variance:
\(s^2 = \frac{\sum f_i (x_i - \bar{x})^2}{n - 1}\)
Finally, take the square root of the variance to get the standard deviation:
\(s = \sqrt{s^2}\).
Verified video answer for a similar problem:This video solution was recommended by our tutors as helpful for the problem above
Video duration:
5mPlay a video:
Was this helpful?
Key Concepts
Here are the essential concepts you must grasp in order to answer the question correctly.
Frequency Distribution
A frequency distribution organizes data into intervals or categories and shows how many data points fall into each. It helps summarize large data sets and is essential for calculating measures like the mean and standard deviation from grouped data.
Recommended video:
Guided course
Intro to Frequency Distributions
Midpoint of Class Intervals
The midpoint is the value halfway between the lower and upper boundaries of a class interval. It represents the typical value for all data points in that interval and is used to approximate calculations such as the mean and standard deviation when only grouped data is available.
Recommended video:
Guided course
Prediction Intervals
Standard Deviation for Grouped Data
Standard deviation measures the spread or variability of data around the mean. For grouped data, it is approximated by using class midpoints and frequencies to calculate the mean and then the squared deviations, weighted by frequency, to find the variance and standard deviation.
Recommended video:
Guided course
Calculating Standard Deviation
Watch next
Master Calculating Standard Deviation with a bite sized video explanation from Patrick
Start learningRelated Videos
Related Practice
Textbook Question
17
views
