Ch. 6 - Normal Probability Distributions
Triola - Elementary Statistics 14th Edition
Triola14th EditionElementary StatisticsISBN: 9780137366446Not the one you use?Change textbook
Chapter 6, Problem 6.1.6

Continuous Uniform Distribution. In Exercises 5–8, refer to the continuous uniform distribution depicted in Figure 6-2 and described in Example 1. Assume that a passenger is randomly selected, and find the probability that the waiting time is within the given range.

Less than 4.00 minutes

Verified step by step guidance
1
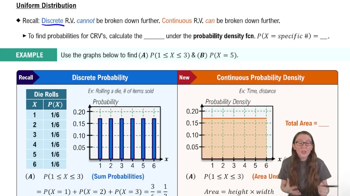
Step 1: Understand the continuous uniform distribution. In this case, the waiting time is uniformly distributed between 0 and 5 minutes, as shown in the graph. The probability density function (PDF) is constant at 0.2, and the total area under the curve equals 1.
Step 2: Recall the formula for the probability in a continuous uniform distribution. The probability of a random variable falling within a range [a, b] is given by the area under the curve between those limits. This is calculated as P(a ≤ X ≤ b) = (b - a) × f(x), where f(x) is the constant height of the PDF.
Step 3: Identify the range of interest. The problem asks for the probability that the waiting time is less than 4.00 minutes. This corresponds to the range [0, 4].
Step 4: Apply the formula. Substitute the values into the formula: P(0 ≤ X ≤ 4) = (4 - 0) × 0.2. This represents the area of the rectangle from x = 0 to x = 4 under the curve.
Step 5: Interpret the result. The calculated area represents the probability that the waiting time is less than 4.00 minutes. This probability is proportional to the area under the curve within the specified range.

Verified video answer for a similar problem:

This video solution was recommended by our tutors as helpful for the problem above.
Video duration:
2m
Was this helpful?

Key Concepts

Here are the essential concepts you must grasp in order to answer the question correctly.

Continuous Uniform Distribution

A continuous uniform distribution is a probability distribution where all outcomes are equally likely within a specified range. The probability density function (PDF) is constant across this range, resulting in a rectangular shape when graphed. For example, if waiting times are uniformly distributed between 0 and 5 minutes, every time within this interval has the same likelihood of occurring.
Recommended video:
06:06
Uniform Distribution

Probability Density Function (PDF)

The probability density function (PDF) describes the likelihood of a continuous random variable taking on a specific value. In the case of a continuous uniform distribution, the PDF is a horizontal line, indicating that the probability is evenly distributed across the range. The area under the PDF curve represents the total probability, which equals 1 for a valid distribution.
Recommended video:
5:37
Introduction to Probability

Calculating Probability

To find the probability of a continuous random variable falling within a certain range, you calculate the area under the PDF over that interval. For example, to find the probability that a passenger's waiting time is less than 4 minutes in a uniform distribution from 0 to 5 minutes, you would determine the area of the rectangle formed by the interval from 0 to 4, which is the height of the PDF multiplied by the width of the interval.
Recommended video:
Guided course
07:09
Probability From Given Z-Scores - TI-84 (CE) Calculator
Related Practice
Textbook Question

Continuous Uniform Distribution. In Exercises 5–8, refer to the continuous uniform distribution depicted in Figure 6-2 and described in Example 1. Assume that a passenger is randomly selected, and find the probability that the waiting time is within the given range.


Between 2 minutes and 3 minutes

167
views
Textbook Question

Hypothesis Testing. In Exercises 17–19, apply the central limit theorem to test the given claim. (Hint: See Example 3.)


Adult Sleep Times (hours) of sleep for randomly selected adult subjects included in the National Health and Nutrition Examination Study are listed below. Here are the statistics for this sample: n = 12, x_bar = 6.8 hours, s = 20 hours. The times appear to be from a normally distributed population. A common recommendation is that adults should sleep between 7 hours and 9 hours each night. Assuming that the mean sleep time is 7 hours, find the probability of getting a sample of 12 adults with a mean of 6.8 hours or less. What does the result suggest about a claim that “the mean sleep time is less than 7 hours”?


4 8 4 4 8 6 9 7 7 10 7 8

169
views
Textbook Question

Standard Normal Distribution. In Exercises 9–12, find the area of the shaded region. The graph depicts the standard normal distribution of bone density scores with mean 0 and standard deviation 1.


432
views
Textbook Question

Births: Sampling Distribution of Sample Proportion When two births are randomly selected, the sample space for genders is bb, bg, gb, and gg (where and Assume that those four outcomes are equally likely. Construct a table that describes the sampling distribution of the sample proportion of girls from two births. Does the mean of the sample proportions equal the proportion of girls in two births? Does the result suggest that a sample proportion is an unbiased estimator of a population proportion?

178
views
Textbook Question

Distributions In a continuous uniform distribution,


" style="" width="290">


a. Find the mean and standard deviation for the distribution of the waiting times represented in Figure 6-2, which accompanies Exercises 5–8.

246
views
Textbook Question

Standard Normal Distribution. In Exercises 17–36, assume that a randomly selected subject is given a bone density test. Those test scores are normally distributed with a mean of 0 and a standard deviation of 1. In each case, draw a graph, then find the probability of the given bone density test scores. If using technology instead of Table A-2, round answers to four decimal places.


Between 1.50 and 2.00

185
views