13. Mendelian Genetics
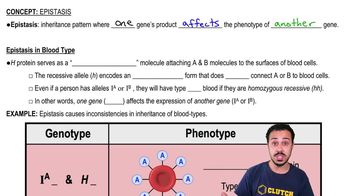
Epistasis
Problem 10
Textbook Question
Textbook QuestionImagine repeating the experiment on epigenetic inheritance that is shown in Figure 19.6. You measure the amount of radioactive uridine (U) incorporated into Hnf4a mRNA in counts per minute (cpm) to determine the level of Hnf4a gene transcription in rats born to mothers fed either a normal diet or a low-protein diet. The results are 11,478 cpm for the normal diet and 7368 cpm for the low-protein diet. For this problem, your task is to prepare a graph similar to the one at the bottom of Figure 19.6 that shows the normalized results for the low-protein diet relative to the normal diet. Normalizing values means that the value obtained from one condition is expressed as 1.0 (the norm; the normal diet in this case) and the values obtained from any other conditions (low-protein diet in this case) are expressed as decimal values relative to the norm.

 Verified Solution
This video solution was recommended by our tutors as helpful for the problem above
Video duration:
1m224
views
Was this helpful?
Related Videos
Related Practice
 05:37
05:37