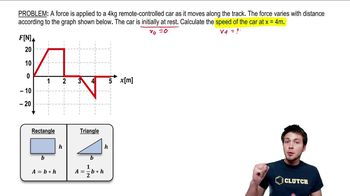
So and this was going to show you how to calculate the work that's done on an object by using a force versus displacement graph. So some problems are just going to give you a diagram or graph like this that plots the force and the y axis with the position in the X axis. And they'll ask you to calculate how much work is done on an object by some force. We've actually seen something very similar to this in a previous chapter. So let's just get to it. The whole idea here is that the work that is done by any force, whether it's constant or variable is really just going to be the area that is under that fx graph. What that means that phrase under the graph is it just means the area that's between the graph and the X axis. So really instead of using FD cosign theta a bunch of times to calculate work, all we do is we just figure out what's the area that is underneath the graph between where you are on the function and the X. Axis. So there's an area right here and then went to goes below the X axis. There's also another area that's here. So the whole idea here is that again, instead of using F. D. Co sign Thetis, we're really just gonna be breaking up this graph into a bunch of rectangles and triangles and using some pretty basic geometry equations to solve it. Let's check this out. So to calculate the work that's done by the force, we're just going to take the area that's underneath the curve. And what we can do here to make this a little bit easier for us is break this up into a bunch of simpler shapes. So if I break this up like this I've got a rectangle like here and I'm gonna call this area to one. So then I've got this triangle like this that area too. And then I've got another triangle that's going to be down here. I'm gonna call this area three. So the whole idea is that they calculate the whole work that's done on this uh on this object. I'm just gonna be adding up all of those areas Area one, Area two and area three. So the area one is the rectangle, Area two is the triangle. And then area three is also a smaller triangle, it's below the X. Axis. All right, so let's get to this area one. So to use area is to figure out the area of a rectangle. We're just gonna use base times height. So this is base times height. So, I'm just gonna look at this rectangle here and figure out the basin height by using the numbers on the axes. So, I've got a base of four and then I've got a height of 30. So this is gonna be four times 30. And I've got area one is equal to 120 jewels. Let's move on to the second one for area to we've got a triangle. So we're gonna have to use the area for a triangle, which is one half base times heights. So I've got one half base times height. And if I go ahead and take a look here, the base of this triangle with from 4 to 16. So that's 12. And then the height of this triangle is the same 30 that I was using before. So it's just gonna be one half of 12 times 30. And I get area too is equal to 180 jewels. All right now, finally, for the last area area three, that's the one that's sort of like underneath this X axis over here, I'm going to use this area for triangle, one half base times height. This is gonna be one half. Now, I've got the base of this triangle is four. And the height of this triangle now is not going to be 10 because we're actually going down into the negative access here. So our height that we plug in is actually negative 10. So this is gonna be one half of four times negative 10. And what you end up getting is you end up getting negative 20 jewels. So we can see here that when you have areas above the X axis, those are gonna be positive works because your forces positive. When you have areas below the X axis, those forces are are going to be negative. And so you're gonna have negative work. So basically we've got are three areas. Now we're just going to add them all up together and just calculate, right so this work done this is going to be 120 plus plus negative 20. So when you add it all together you're gonna get the work that's done is equal to 280 jewels. And that's your answer. So this is we can see here that this graph stuff is actually super straightforward if you ever have a variable force instead of using FD coastline data and trying to calculate like F averages or something like that. Just try and see if you can create this sort of like F. Vs. X. Graph. And so therefore you can just calculated by using areas. So try to do that anyway so that's it for this one guys let me know if you have any questions.