Identifying the Shape of a Distribution In Exercises 53–56, construct a frequency distribution and a frequency histogram for the data set using the indicated number of classes. Describe the shape of the histogram as symmetric, uniform, negatively skewed, positively skewed, or none of these.
Heights of Males Number of classes: 5 Data set: The heights (to the nearest inch) of 30 males 67 76 69 68 72 68 65 63 75 69 66 72 67 66 69 73 64 62 71 73 68 72 71 65 69 66 74 72 68 69
Verified step by step guidance
1
Organize the data set: Start by listing the heights of the 30 males in ascending order. This will make it easier to group the data into classes.
Determine the class width: Use the formula for class width: \( \text{Class Width} = \frac{\text{Range}}{\text{Number of Classes}} \). First, calculate the range by subtracting the smallest value from the largest value in the data set. Then divide the range by the number of classes (5 in this case) and round up to the nearest whole number.
Create the class intervals: Start with the smallest value in the data set as the lower limit of the first class. Add the class width to determine the upper limit of the first class. Repeat this process to create all 5 class intervals, ensuring there is no overlap between classes.
Construct the frequency distribution: Count how many data points fall into each class interval and record these counts as the frequencies for each class. This will give you the frequency distribution table.
Draw the frequency histogram: Plot the class intervals on the x-axis and the frequencies on the y-axis. Use bars to represent the frequencies for each class. Once the histogram is complete, analyze its shape to determine if it is symmetric, uniform, negatively skewed, positively skewed, or none of these.
Verified video answer for a similar problem:
This video solution was recommended by our tutors as helpful for the problem above
Video duration:
7m
Play a video:
0 Comments
Key Concepts
Here are the essential concepts you must grasp in order to answer the question correctly.
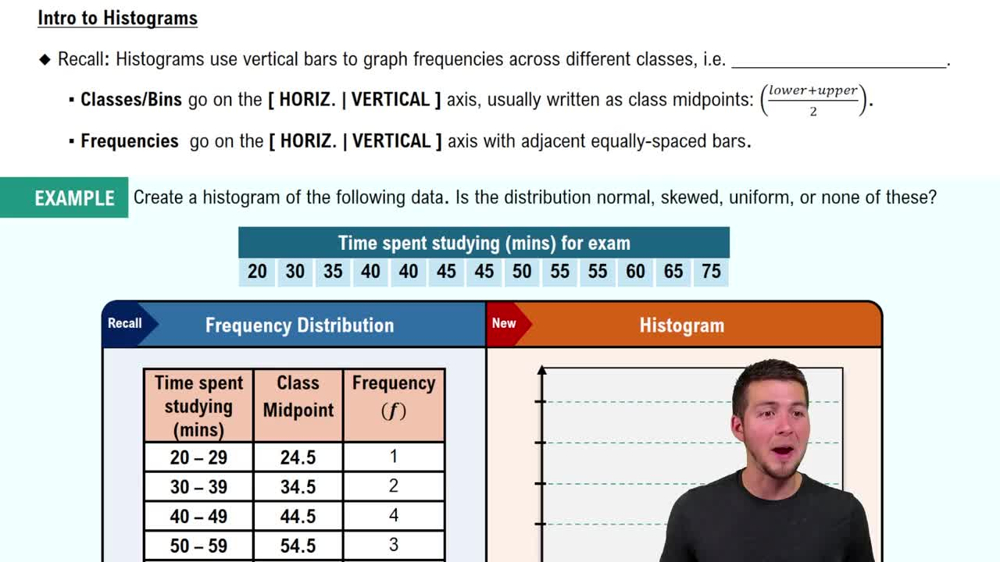
Frequency Distribution
A frequency distribution is a summary of how often each value occurs in a dataset. It organizes data into classes or intervals, showing the number of observations within each class. This helps in understanding the distribution of data points and identifying patterns or trends, which is essential for visualizing the data in a histogram.
A histogram is a graphical representation of the frequency distribution of a dataset. It consists of bars where the height of each bar corresponds to the frequency of data points within a specific interval. Histograms provide a visual way to assess the shape of the data distribution, making it easier to identify characteristics such as symmetry, skewness, and modality.
The shape of a distribution refers to the visual appearance of the histogram and can indicate the underlying characteristics of the data. Common shapes include symmetric (bell-shaped), uniform (flat), positively skewed (tail on the right), and negatively skewed (tail on the left). Understanding the shape helps in interpreting the data's behavior and making informed statistical inferences.

 Verified step by step guidance
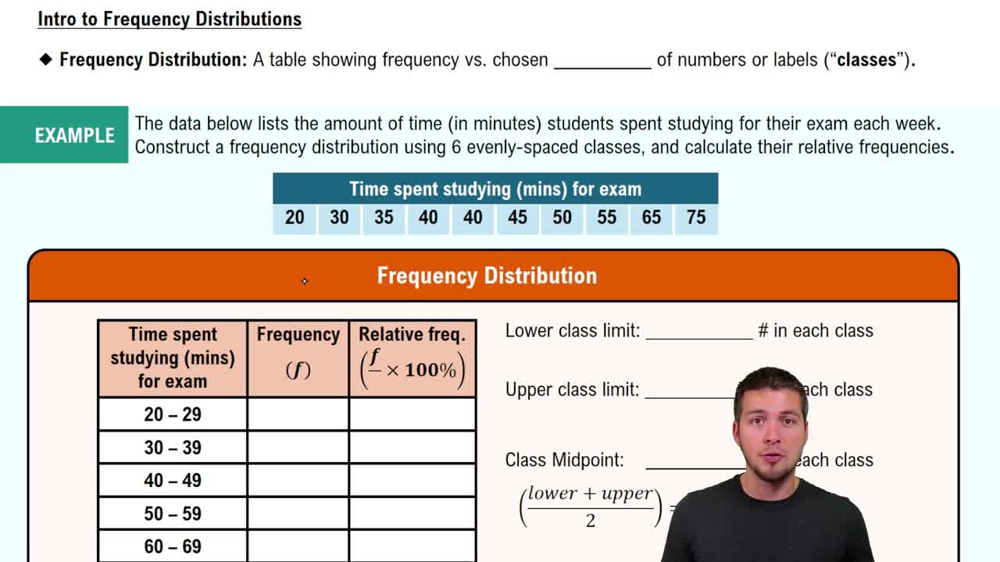
 06:38
06:38