Textbook Question
Testing Goodness-of-Fit with a Normal Distribution Refer to Data Set 1 “Body Data” in Appendix B for the heights of females.
" style="" width="600">
a. Enter the observed frequencies in the table above.
107
views

 Verified step by step guidance
 04:14 04:14
Testing Goodness-of-Fit with a Normal Distribution Refer to Data Set 1 “Body Data” in Appendix B for the heights of females.
" style="" width="600">
a. Enter the observed frequencies in the table above.
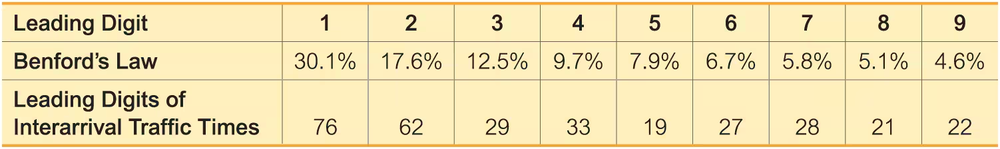
Cybersecurity The table below lists the frequency of leading digits of Internet traffic interarrival times for a computer, along with the percentages of each leading digit expected with Benford’s law.
b. Identify the observed and expected values for the leading digit of 2.
" style="max-width: 100%; white-space-collapse: preserve;" width="650">
Does the Treatment Affect Success? The following table lists frequencies of successes and failures for different treatments used for a stress fracture in a foot bone (based on data from “Surgery Unfounded for Tarsal Navicular Stress Fracture,” by Bruce Jancin, Internal Medicine News, Vol. 42, No. 14). Use a 0.05 significance level to test the claim that success of the treatment is independent of the type of treatment. What does the result indicate about the increasing trend to use surgery?
Testing Goodness-of-Fit with a Normal Distribution Refer to Data Set 1 “Body Data” in Appendix B for the heights of females.
" style="max-width: 100%; white-space-collapse: preserve;" width="600">
b. Assuming a normal distribution with mean and standard deviation given by the sample mean and standard deviation, use the methods of Chapter 6 to find the probability of a randomly selected height belonging to each class.
Cybersecurity The table below lists the frequency of leading digits of Internet traffic interarrival times for a computer, along with the percentages of each leading digit expected with Benford’s law.
c. Use the results from part (b) to find the contribution to the x2 test statistic from the category representing the leading digit of 2.
" style="max-width: 100%; white-space-collapse: preserve;" width="650">
Weather-Related Deaths For the most recent year as of this writing, the numbers of weather-related U.S. deaths for each month were 61, 14, 22, 26, 29, 42, 93, 49, 47, 35, 96, 16, listed in order beginning with January (based on data from the National Weather Service). Use a 0.01 significance level to test the claim that weather-related deaths occur in the different months with the same frequency. Provide an explanation for the result.