Table of contents
- 1. Intro to Stats and Collecting Data1h 14m
- 2. Describing Data with Tables and Graphs1h 55m
- 3. Describing Data Numerically2h 5m
- 4. Probability2h 16m
- 5. Binomial Distribution & Discrete Random Variables3h 6m
- 6. Normal Distribution and Continuous Random Variables2h 11m
- 7. Sampling Distributions & Confidence Intervals: Mean3h 23m
- Sampling Distribution of the Sample Mean and Central Limit Theorem19m
- Distribution of Sample Mean - Excel23m
- Introduction to Confidence Intervals15m
- Confidence Intervals for Population Mean1h 18m
- Determining the Minimum Sample Size Required12m
- Finding Probabilities and T Critical Values - Excel28m
- Confidence Intervals for Population Means - Excel25m
- 8. Sampling Distributions & Confidence Intervals: Proportion2h 10m
- 9. Hypothesis Testing for One Sample5h 9m
- Steps in Hypothesis Testing1h 6m
- Performing Hypothesis Tests: Means1h 4m
- Hypothesis Testing: Means - Excel42m
- Performing Hypothesis Tests: Proportions37m
- Hypothesis Testing: Proportions - Excel27m
- Performing Hypothesis Tests: Variance12m
- Critical Values and Rejection Regions28m
- Link Between Confidence Intervals and Hypothesis Testing12m
- Type I & Type II Errors17m
- 10. Hypothesis Testing for Two Samples5h 37m
- Two Proportions1h 13m
- Two Proportions Hypothesis Test - Excel28m
- Two Means - Unknown, Unequal Variance1h 3m
- Two Means - Unknown Variances Hypothesis Test - Excel12m
- Two Means - Unknown, Equal Variance15m
- Two Means - Unknown, Equal Variances Hypothesis Test - Excel9m
- Two Means - Known Variance12m
- Two Means - Sigma Known Hypothesis Test - Excel21m
- Two Means - Matched Pairs (Dependent Samples)42m
- Matched Pairs Hypothesis Test - Excel12m
- Two Variances and F Distribution29m
- Two Variances - Graphing Calculator16m
- 11. Correlation1h 24m
- 12. Regression3h 33m
- Linear Regression & Least Squares Method26m
- Residuals12m
- Coefficient of Determination12m
- Regression Line Equation and Coefficient of Determination - Excel8m
- Finding Residuals and Creating Residual Plots - Excel11m
- Inferences for Slope31m
- Enabling Data Analysis Toolpak1m
- Regression Readout of the Data Analysis Toolpak - Excel21m
- Prediction Intervals13m
- Prediction Intervals - Excel19m
- Multiple Regression - Excel29m
- Quadratic Regression15m
- Quadratic Regression - Excel10m
- 13. Chi-Square Tests & Goodness of Fit2h 21m
- 14. ANOVA2h 28m
11. Correlation
Correlation Coefficient
Struggling with Statistics?
Join thousands of students who trust us to help them ace their exams!Watch the first videoMultiple Choice
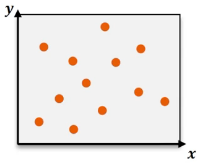
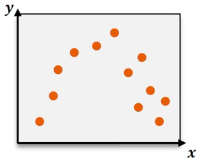
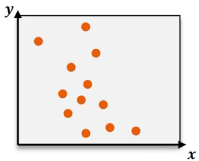
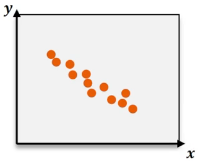
A data set is found to have a linear correlation coefficient of . Which of the following graphs most likely represents the relationship between these variables?
A
B
C
D
Verified step by step guidance1
Step 1: Understand the linear correlation coefficient (r). A value of r = -0.92 indicates a strong negative linear relationship between the two variables. This means that as one variable increases, the other variable tends to decrease in a linear fashion.
Step 2: Analyze the graphs provided. Look for a graph where the data points form a clear downward trend, indicating a negative linear relationship. The points should be relatively close to a straight line, reflecting the strong correlation (r close to -1).
Step 3: Eliminate graphs that do not show a linear relationship. For example, graphs with scattered points (no clear trend) or a curved pattern (non-linear relationship) are not consistent with a strong negative linear correlation.
Step 4: Identify the graph that best matches the description of a strong negative linear relationship. This graph should show data points forming a downward-sloping line with minimal scatter.
Step 5: Based on the analysis, the graph that most likely represents the relationship between the variables is the fourth graph, as it shows a clear downward trend with points closely aligned to a straight line.
Watch next
Master Correlation Coefficient with a bite sized video explanation from Patrick
Start learningRelated Videos
Related Practice
Multiple Choice
In statistics, which value represents the strongest possible linear correlation coefficient?
1
views
Correlation Coefficient practice set

