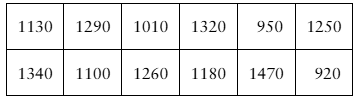
Constructing a Confidence Interval In Exercises 25–28, use the data set to (b) find the sample standard deviation. Assume the population is normally distributed. SAT Scores The SAT scores of 12 randomly selected high school seniors
Verified step by step guidance
1
Step 1: Write down the SAT scores provided in the data set: {1130, 1290, 1010, 1320, 950, 1250, 1340, 1100, 1260, 1180, 1470, 920}.
Step 2: Calculate the mean (average) of the data set using the formula: \( \text{Mean} = \frac{\sum x_i}{n} \), where \( x_i \) represents each individual score and \( n \) is the total number of scores.
Step 3: Compute the squared differences from the mean for each score using the formula: \( (x_i - \text{Mean})^2 \).
Step 4: Find the variance by summing all the squared differences and dividing by \( n-1 \) (since this is a sample, not a population): \( \text{Variance} = \frac{\sum (x_i - \text{Mean})^2}{n-1} \).
Step 5: Calculate the sample standard deviation by taking the square root of the variance: \( \text{Standard Deviation} = \sqrt{\text{Variance}} \).
Verified video answer for a similar problem:
This video solution was recommended by our tutors as helpful for the problem above
Video duration:
3m
Play a video:
0 Comments
Key Concepts
Here are the essential concepts you must grasp in order to answer the question correctly.
Sample Standard Deviation
The sample standard deviation is a measure of the amount of variation or dispersion in a set of sample data points. It quantifies how much the individual scores differ from the sample mean. To calculate it, you take the square root of the variance, which is the average of the squared differences from the mean. This concept is crucial for understanding the spread of SAT scores in the given data set.
Normal distribution is a probability distribution that is symmetric about the mean, showing that data near the mean are more frequent in occurrence than data far from the mean. In statistics, many tests and confidence intervals assume that the underlying data is normally distributed, which simplifies analysis and interpretation. This assumption is important when constructing confidence intervals for the SAT scores.
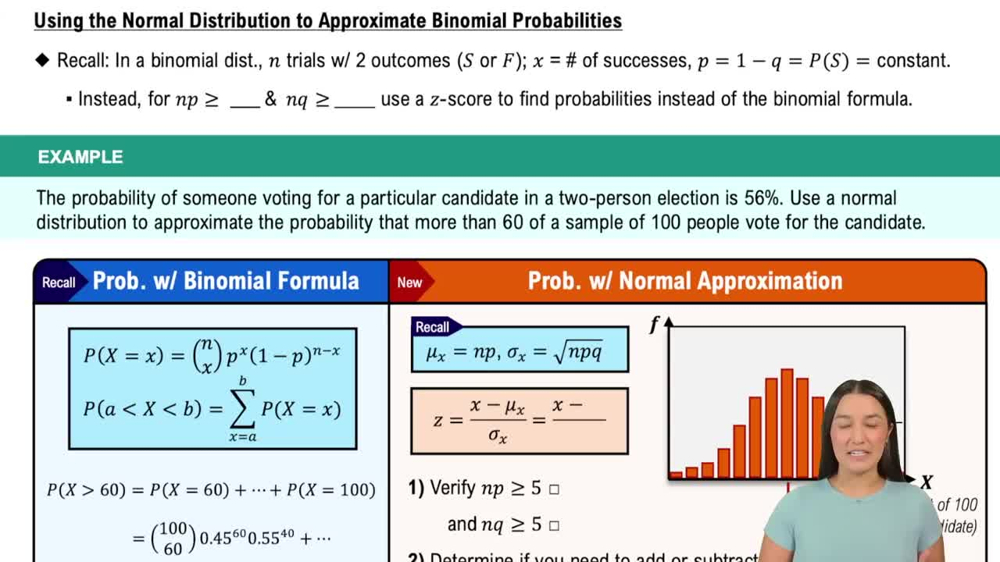
Using the Normal Distribution to Approximate Binomial Probabilities
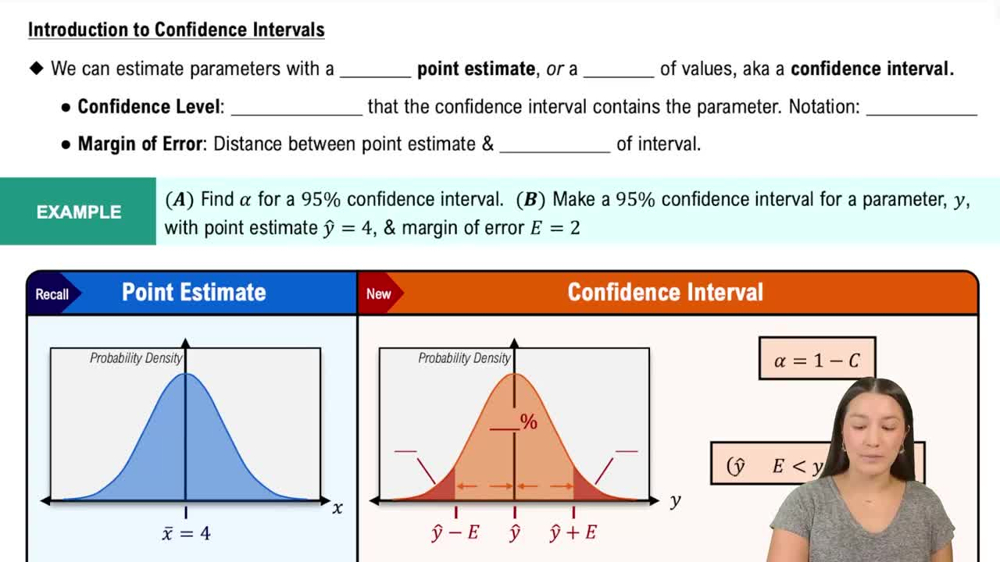
Confidence Interval
A confidence interval is a range of values, derived from a data set, that is likely to contain the true population parameter with a specified level of confidence, typically 95% or 99%. It provides an estimate of uncertainty around a sample statistic, such as the mean. Understanding how to construct and interpret confidence intervals is essential for making inferences about the population based on the sample data provided.

 Verified step by step guidance
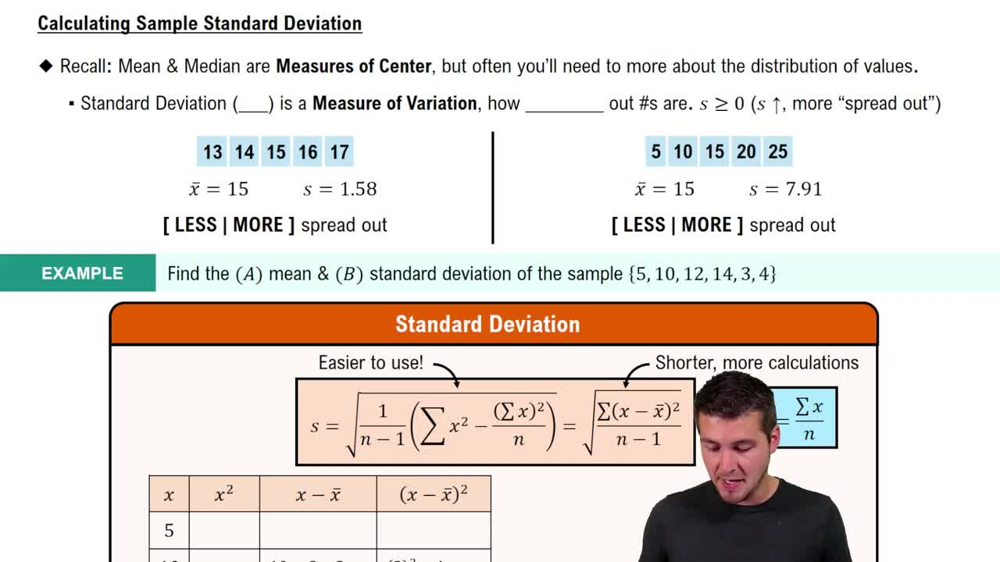
 08:45
08:45