Which type of graph uses to show how each category relates to the whole data set?
Table of contents
- 1. Intro to Stats and Collecting Data1h 14m
- 2. Describing Data with Tables and Graphs1h 55m
- 3. Describing Data Numerically2h 5m
- 4. Probability2h 16m
- 5. Binomial Distribution & Discrete Random Variables3h 6m
- 6. Normal Distribution and Continuous Random Variables2h 11m
- 7. Sampling Distributions & Confidence Intervals: Mean3h 23m
- Sampling Distribution of the Sample Mean and Central Limit Theorem19m
- Distribution of Sample Mean - Excel23m
- Introduction to Confidence Intervals15m
- Confidence Intervals for Population Mean1h 18m
- Determining the Minimum Sample Size Required12m
- Finding Probabilities and T Critical Values - Excel28m
- Confidence Intervals for Population Means - Excel25m
- 8. Sampling Distributions & Confidence Intervals: Proportion1h 25m
- 9. Hypothesis Testing for One Sample3h 29m
- 10. Hypothesis Testing for Two Samples4h 50m
- Two Proportions1h 13m
- Two Proportions Hypothesis Test - Excel28m
- Two Means - Unknown, Unequal Variance1h 3m
- Two Means - Unknown Variances Hypothesis Test - Excel12m
- Two Means - Unknown, Equal Variance15m
- Two Means - Unknown, Equal Variances Hypothesis Test - Excel9m
- Two Means - Known Variance12m
- Two Means - Sigma Known Hypothesis Test - Excel21m
- Two Means - Matched Pairs (Dependent Samples)42m
- Matched Pairs Hypothesis Test - Excel12m
- 11. Correlation1h 24m
- 12. Regression1h 50m
- 13. Chi-Square Tests & Goodness of Fit2h 21m
- 14. ANOVA1h 57m
2. Describing Data with Tables and Graphs
Pie Charts
Struggling with Statistics?
Join thousands of students who trust us to help them ace their exams!Watch the first videoMultiple Choice
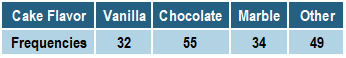
A student wants to use the table to create a pie chart demonstrating the cake preferences of their classmates. Find the percent of students who prefer vanilla cake.

A
B
C
D
Verified step by step guidance1
Step 1: Begin by identifying the total number of students surveyed. To do this, sum up the frequencies for all cake flavors: Vanilla (32), Chocolate (55), Marble (34), and Other (49). Use the formula: Total = 32 + 55 + 34 + 49.
Step 2: Calculate the proportion of students who prefer vanilla cake. Divide the frequency of vanilla cake (32) by the total number of students obtained in Step 1. Use the formula: Proportion = Frequency of Vanilla / Total.
Step 3: Convert the proportion obtained in Step 2 into a percentage. Multiply the proportion by 100 to express it as a percentage. Use the formula: Percentage = Proportion × 100.
Step 4: Verify your calculation by ensuring the sum of percentages for all cake flavors equals approximately 100%. This step helps confirm the accuracy of your work.
Step 5: Use the percentage calculated in Step 3 to create the pie chart segment for vanilla cake. Label the segment with the percentage value and ensure the chart visually represents the proportions of all cake preferences.
Related Videos
Related Practice
Multiple Choice
16
views

