


Ch. 6 - Confidence Intervals
Larson - Elementary Statistics: Picturing the World 8th Edition
Larson8th EditionElementary Statistics: Picturing the WorldISBN: 9780137493470Not the one you use?Change textbook
Chapter 6, Problem 6.2.31a

Constructing a Confidence Interval In Exercises 31 and 32, use the data set to (a) find the sample mean
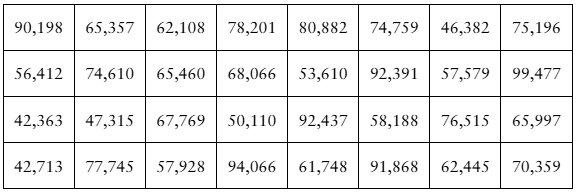
[APPLET] Earnings The annual earnings (in dollars) of 32 randomly selected intermediate level life insurance underwriters (Adapted from Salary.com)
Table displaying annual earnings in dollars of 32 life insurance underwriters, with values organized in rows and columns.

Verified step by step guidance
1
Step 1: Organize the data set provided in the table. There are 32 annual earnings values listed. Ensure all values are correctly noted for calculations.
Step 2: Calculate the sample mean (denoted as \( \bar{x} \)) by summing all the earnings values and dividing by the total number of data points (32). Use the formula \( \bar{x} = \frac{\sum x_i}{n} \), where \( x_i \) represents each individual data point and \( n \) is the sample size.
Step 3: Compute the sample standard deviation (denoted as \( s \)) using the formula \( s = \sqrt{\frac{\sum (x_i - \bar{x})^2}{n-1}} \). This involves finding the squared differences between each data point and the sample mean, summing them, dividing by \( n-1 \), and taking the square root.
Step 4: Determine the critical value (\( t \)) for the desired confidence level using a t-distribution table. The degrees of freedom (df) are \( n-1 \), where \( n \) is the sample size.
Step 5: Construct the confidence interval using the formula \( \bar{x} \pm t \cdot \frac{s}{\sqrt{n}} \). This involves adding and subtracting the margin of error (\( t \cdot \frac{s}{\sqrt{n}} \)) from the sample mean to find the lower and upper bounds of the interval.

Verified video answer for a similar problem:

This video solution was recommended by our tutors as helpful for the problem above.
Video duration:
1m
Was this helpful?

Key Concepts

Here are the essential concepts you must grasp in order to answer the question correctly.

Sample Mean

The sample mean is the average of a set of values obtained from a sample of a population. It is calculated by summing all the values in the sample and dividing by the number of observations. The sample mean serves as a point estimate of the population mean and is a fundamental statistic used in inferential statistics.
Recommended video:
05:11
Sampling Distribution of Sample Proportion

Confidence Interval

A confidence interval is a range of values, derived from a sample, that is likely to contain the population parameter with a specified level of confidence, typically 95% or 99%. It provides an estimate of uncertainty around the sample mean, indicating how much the sample mean might vary from the true population mean. The width of the interval is influenced by the sample size and variability.
Recommended video:
06:33
Introduction to Confidence Intervals

Random Sampling

Random sampling is a technique used to select a subset of individuals from a larger population, ensuring that each individual has an equal chance of being chosen. This method helps to eliminate bias and allows for the generalization of results from the sample to the population. In the context of the question, the earnings data is based on a random sample of life insurance underwriters, which is crucial for valid statistical inference.
Recommended video:
05:11
Sampling Distribution of Sample Proportion
Related Practice
Textbook Question

Constructing Confidence Intervals In Exercises 13–24, assume the sample is from a normally distributed population and construct the indicated confidence intervals for (a) the population variance σ^2. Interpret the results.

[APPLET] Earnings The annual earnings (in thousands of dollars) of 21 randomly selected level 1 computer hardware engineers are listed. Use a 99% level of confidence. (Adapted from Salary.com)

95
views
Textbook Question

Constructing Confidence Intervals In Exercises 13–24, assume the sample is from a normally distributed population and construct the indicated confidence intervals for (a) the population variance σ^2. Interpret the results.

Volleyball The numbers of service aces scored by 15 teams randomly selected from the top 50 NCAA Division I Women’s Volleyball teams for the 2021 season have a sample standard deviation of 26.1. Use an 80% level of confidence. (Source: National Collegiate Athletic Association)

59
views
Textbook Question

Fast Food You wish to estimate, with 90% confidence, the population proportion of U.S. families who eat fast food at least once per week. Your estimate must be accurate within 3% of the population proportion.

a. No preliminary estimate is available. Find the minimum sample size needed.

72
views
Textbook Question

Constructing Confidence Intervals In Exercises 13–24, assume the sample is from a normally distributed population and construct the indicated confidence intervals for (a) the population variance σ^2. Interpret the results.

Car Batteries The reserve capacities (in hours) of 18 randomly selected automotive batteries have a sample standard deviation of 0.25 hour. Use an 80% level of confidence.

93
views
Textbook Question

Paint Can Volumes A paint manufacturer uses a machine to fill gallon cans with paint (see figure). The manufacturer wants to estimate the mean volume of paint the machine is putting in the cans within 0.5 ounce. Assume the population of volumes is normally distributed.

a. Determine the minimum sample size required to construct a 90% confidence interval for the population mean. Assume the population standard deviation is 0.75 ounce.

67
views
Textbook Question

Constructing a Confidence Interval In Exercises 25–28, use the data set to (a) find the sample mean. Assume the population is normally distributed.

SAT Scores The SAT scores of 12 randomly selected high school seniors

95
views