Ch 02: Motion Along a Straight Line
Young & Freedman Calc - University Physics 14th Edition
Young & Freedman Calc14th EditionUniversity PhysicsISBN: 9780321973610Not the one you use?Change textbook
Chapter 2, Problem 13

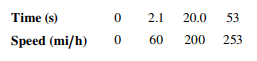
The table shows test data for the Bugatti Veyron Super Sport, the fastest street car made. The car is moving in a straight line (the xx-axis).
(a) Sketch a vxv_{x}-tt graph of this car's velocity (in mi/h) as a function of time. Is its acceleration constant?
(b) Calculate the car's average acceleration (in m/s2) between (i) 00 and 2.12.1 s; (ii) 2.12.1 s and 20.020.0 s; (iii) 20.020.0 s and 5353 s. Are these results consistent with your graph in part (a)? (Before you decide to buy this car, it might be helpful to know that only 300300 will be built, it runs out of gas in 1212 minutes at top speed, and it costs more than $1.5\$1.5 million!)
"Table showing Bugatti Veyron's speed: 0s-0mi/h, 2.1s-60mi/h, 20s-200mi/h, 53s-253mi/h."

Verified step by step guidance
1
Step 1: To sketch the v_x-t graph, plot the given data points on a graph with time (t) on the x-axis and velocity (v_x) on the y-axis. Connect the points to visualize the velocity changes over time.
Step 2: Analyze the graph to determine if the acceleration is constant. Constant acceleration would be indicated by a straight line on the v_x-t graph. If the line is not straight, the acceleration is not constant.
Step 3: To calculate the average acceleration between 0 and 2.1 s, use the formula: a_avg = (v_f - v_i) / (t_f - t_i), where v_f and v_i are the final and initial velocities, and t_f and t_i are the final and initial times. Convert velocities from mi/h to m/s by multiplying by 0.44704.
Step 4: Repeat the average acceleration calculation for the intervals 2.1 s to 20.0 s and 20.0 s to 53 s using the same formula. Ensure to convert all velocities to m/s before calculating.
Step 5: Compare the calculated average accelerations with the graph from part (a) to check for consistency. If the graph shows varying slopes, the accelerations should differ, indicating non-constant acceleration.

Verified video answer for a similar problem:

This video solution was recommended by our tutors as helpful for the problem above.
Video duration:
11m
Was this helpful?

Key Concepts

Here are the essential concepts you must grasp in order to answer the question correctly.

Velocity-Time Graph

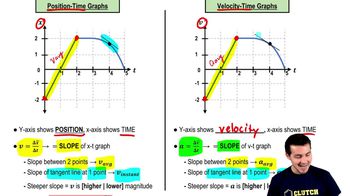
A velocity-time (v-t) graph represents how an object's velocity changes over time. The slope of the graph indicates the object's acceleration. A straight line suggests constant acceleration, while a curve indicates changing acceleration. In this problem, sketching the v-t graph helps visualize the car's velocity changes and assess whether its acceleration is constant.
Recommended video:
Guided course
05:59
Velocity-Time Graphs & Acceleration

Average Acceleration

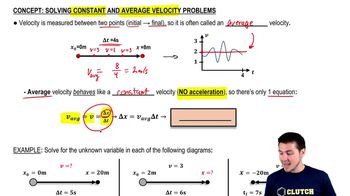
Average acceleration is defined as the change in velocity divided by the time over which the change occurs. It is calculated using the formula a_avg = (v_f - v_i) / (t_f - t_i), where v_f and v_i are the final and initial velocities, and t_f and t_i are the final and initial times. This concept is crucial for determining the car's acceleration over specified time intervals.
Recommended video:
Guided course
05:44
Solving Constant and Average Velocity Problems

Unit Conversion

Unit conversion is essential when working with different measurement systems. In this problem, velocities are given in miles per hour (mi/h), but acceleration needs to be calculated in meters per second squared (m/s²). Converting units accurately ensures correct calculations and comparisons, such as using 1 mi/h = 0.44704 m/s for velocity conversion.
Recommended video:
Guided course
07:46
Unit Conversions
Related Practice
Textbook Question

A physics professor leaves her house and walks along the sidewalk toward campus. After 55 min, it starts to rain, and she returns home. Her distance from her house as a function of time is shown in Fig. E2.102.10. At which of the labeled points is her velocity constant and positive?

1780
views
Textbook Question

A physics professor leaves her house and walks along the sidewalk toward campus. After 55 min, it starts to rain, and she returns home. Her distance from her house as a function of time is shown in Fig. E2.102.10. At which of the labeled points is her velocity constant and negative?

1221
views
Textbook Question

A race car starts from rest and travels east along a straight and level track. For the first 5.05.0 s of the car's motion, the eastward component of the car's velocity is given by vx(t)=v_{x}(t)= (0.8600.860 m/s3)t2. What is the acceleration of the car when vx=12.0v_{x}=12.0 m/s?

4406
views
2
rank
Textbook Question

A turtle crawls along a straight line, which we will call the xx-axis with the positive direction to the right. The equation for the turtle's position as a function of time is x(t)=50.0x(t) = 50.0 cm + (2.002.00 cm/s)tt − (0.06250.0625 cm/s2)t2t^2. At what time tt is the velocity of the turtle zero?

89
views
Textbook Question

A physics professor leaves her house and walks along the sidewalk toward campus. After 55 min, it starts to rain, and she returns home. Her distance from her house as a function of time is shown in Fig. E2.102.10. At which of the labeled points is her velocity decreasing in magnitude?

1186
views
Textbook Question

A turtle crawls along a straight line, which we will call the xx-axis with the positive direction to the right. The equation for the turtle's position as a function of time is x(t)=50.0x(t) = 50.0 cm + (2.002.00 cm/s)tt − (0.06250.0625 cm/s2)t2t^2. Find the turtle's initial velocity, initial position, and initial acceleration.

2780
views