Velocity-Time Graphs & Acceleration Practice Problems
You take a jog in the morning as part of your routine exercise. A colleague uses a coordinates system where the motion is parallel to the x-axis and to the right is the +x direction. The colleague makes measurements of your motion and constructs a graph of velocity as a function of time. Determine the distance you covered in the first 3.0 s and from t = 2.0 s to t = 6.0 s.
One evening, a lady is strolling along a straight line. The line is along the x-axis and to the right is the positive direction. You collect data from the lady's motion and construct a graph of velocity as a function of time. Determine the lady's acceleration at 1.0 s and 3.5 s.
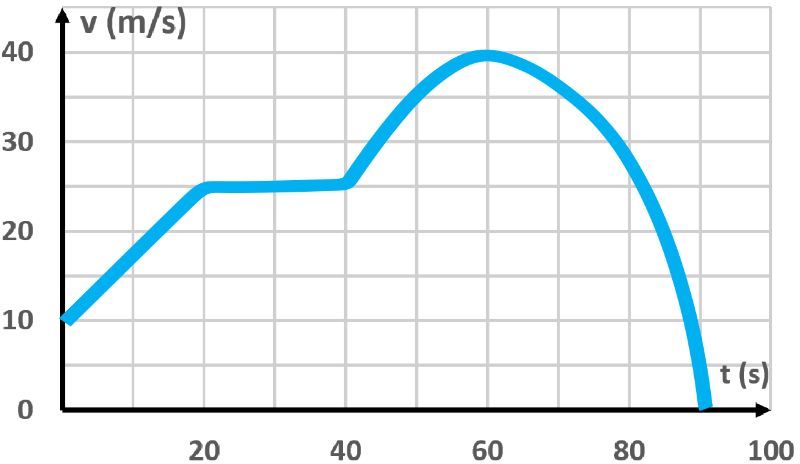
A video is a collection of motion pictures measured in frames/second. Ordinary cameras can attain 60 frames/second. Cameras are used to capture and analyze movements occurring very fast, typically to the order of milliseconds. The nearly vertical launch of a 450 g and 42.0 cm long projectile is shown in the graph below. Use the graph to determine the acceleration of the projectile at 10 ms, 25 ms, and 40 ms. Hint: Approximate the curve to a straight line.
Leaps are very common among animals. A scientist uses high-motion pictures (videos) at 3000 frames/second to analyze the motion of a frog. Frogs have the ability to leap about 20-50 times their length. The motion of a 24 g and 2.52-inch long frog at a nearly vertical take-off angle is plotted using data from motion pictures. Use the graph to determine the maximum height reached by the frog in the first 75 ms and 225 ms.
You are using high-speed motion pictures at 3200 frames/second to analyze a projectile launched from a toy gun at a nearly vertical angle. The projectile has 20 g and is 5 cm long. You generate the graph shown below using data from the motion pictures. From the graph, when is the acceleration of the projectile zero?
An engineer claims to have made a very fast toy truck.
Do you think the acceleration is constant (make a sketch of a velocity-time graph of the toy's velocity (in m/s) as a function of time)? What is the average acceleration of the toy at (i) 0 and 1.5 s; (ii) 1.5 and 12 s (iii) 12 and 25 s?
A bicycle is coasting down the road in a straight line parallel to the x-axis. The image below represents the bicycle's velocity function. Determine the average speed and average velocity of the bicycle for the first 4.5 s.