


 08:25
08:25

Textbook Question
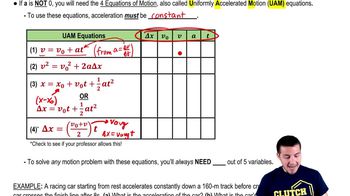
High-speed motion pictures ( frames/second) of a jumping, flea yielded the data used to plot the graph in Fig. E. (See 'The Flying Leap of the Flea' by M. Rothschild, Y. Schlein, K. Parker, C. Neville, and S. Sternberg in the November Scientific American.) This flea was about mm long and jumped at a nearly vertical takeoff angle. Use the graph to answer this question: Is the acceleration of the flea ever zero? If so, when? Justify your answer.
1616
views