
Textbook Question
In Exercises 27–30, find the critical values and for the level of confidence c and sample size n.
c = 0.95, n = 13
97
views

 Verified step by step guidance

 06:33
06:33
 05:11
05:11 04:48
04:48In Exercises 27–30, find the critical values and for the level of confidence c and sample size n.
c = 0.95, n = 13
In Exercises 27–30, find the critical values and for the level of confidence c and sample size n.
c = 0.98, n = 25
The data set represents the weights (in pounds) of 10 randomly selected black bears from northeast Pennsylvania. Assume the weights are normally distributed. (Source: Pennsylvania Game Commission)
b. Construct a 95% confidence interval for the population mean. Interpret the results.
In Exercises 27–30, find the critical values and for the level of confidence c and sample size n.
c = 0.99, n = 10
In a survey of 2096 U.S. adults, 1740 think football teams of all levels should require players who suffer a head injury to take a set amount of time off from playing to recover. (Adapted from The Harris Poll)
a. Find the point estimate for the population proportion.
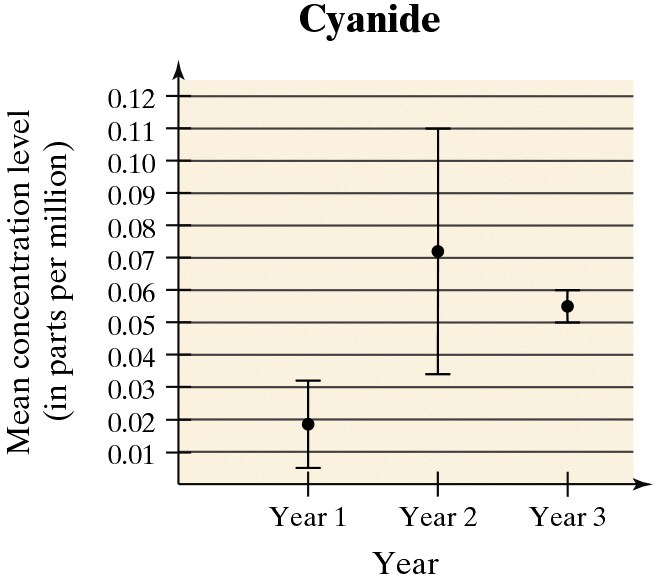
The Safe Drinking Water Act, which was passed in 1974, allows the Environmental Protection Agency (EPA) to regulate the levels of contaminants in drinking water. The EPA requires that water utilities give their customers water quality reports annually. These reports include the results of daily water quality monitoring, which is performed to determine whether drinking water is safe for consumption. A water department tests for contaminants at water treatment plants and at customers’ taps. These contaminants include microorganisms, organic chemicals, and inorganic chemicals, such as cyanide. Cyanide’s presence in drinking water is the result of discharges from steel, plastics, and fertilizer factories. For drinking water, the maximum contaminant level of cyanide is 0.2 parts per million. As part of your job for your city’s water department, you are preparing a report that includes an analysis of the results shown in the figure at the right. The figure shows the point estimates for the population mean concentration and the 95% confidence intervals for cyanide over a three-year period. The data are based on random water samples taken by the city’s three water treatment plants.
The confidence interval for Year 2 is much larger than that for the other years. What do you think may have caused this larger confidence level?