Ch. 8 - Hypothesis Testing
Triola - Elementary Statistics 14th Edition
Triola14th EditionElementary StatisticsISBN: 9780137366446Not the one you use?Change textbook
Chapter 8, Problem 8.4.5

Testing Claims About Variation
In Exercises 5–16, test the given claim. Identify the null hypothesis, alternative hypothesis, test statistic, P-value, or critical value(s), then state the conclusion about the null hypothesis, as well as the final conclusion that addresses the original claim. Assume that a simple random sample is selected from a normally distributed population.
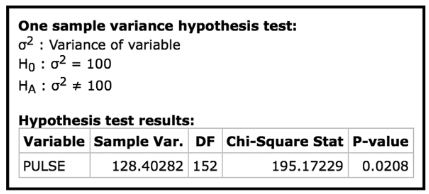
Pulse Rates of Men A simple random sample of 153 men results in a standard deviation of 11.3 beats per minute (based on Data Set 1 “Body Data” in Appendix B). The normal range of pulse rates of adults is typically given as 60 to 100 beats per minute. If the range rule of thumb is applied to that normal range, the result is a standard deviation of 10 beats per minute. Use the sample results with a 0.05 significance level to test the claim that pulse rates of men have a standard deviation equal to 10 beats per minute; see the accompanying StatCrunch display for this test. What do the results indicate about the effectiveness of using the range rule of thumb with the “normal range” from 60 to 100 beats per minute for estimating in this case?
"Table showing one-sample variance test for pulse rates with chi-square statistic 195.17 and p-value 0.0208."

Verified step by step guidance
1
Step 1: Identify the null hypothesis (H₀) and alternative hypothesis (Hₐ). The null hypothesis states that the standard deviation of pulse rates is equal to 10 beats per minute (variance = 100). The alternative hypothesis states that the standard deviation is not equal to 10 beats per minute (variance ≠ 100).
Step 2: Determine the test statistic. The test statistic for a variance hypothesis test is calculated using the formula χ² = (n - 1) * s² / σ², where n is the sample size, s² is the sample variance, and σ² is the hypothesized variance. From the StatCrunch display, the Chi-Square statistic is given as 195.17229.
Step 3: Identify the degrees of freedom (DF). The degrees of freedom for this test are calculated as n - 1, where n is the sample size. In this case, DF = 153 - 1 = 152.
Step 4: Compare the P-value to the significance level (α = 0.05). The P-value is provided as 0.0208. If the P-value is less than α, we reject the null hypothesis; otherwise, we fail to reject it.
Step 5: State the conclusion. Based on the P-value (0.0208 < 0.05), we reject the null hypothesis. This indicates that the pulse rates of men do not have a standard deviation equal to 10 beats per minute. The results suggest that the range rule of thumb may not be effective for estimating the standard deviation in this case.

Verified video answer for a similar problem:

This video solution was recommended by our tutors as helpful for the problem above.
Video duration:
3m
Was this helpful?

Key Concepts

Here are the essential concepts you must grasp in order to answer the question correctly.

Hypothesis Testing

Hypothesis testing is a statistical method used to make inferences about population parameters based on sample data. It involves formulating two competing hypotheses: the null hypothesis (H0), which represents a statement of no effect or no difference, and the alternative hypothesis (HA), which indicates the presence of an effect or difference. The goal is to determine whether there is enough evidence in the sample data to reject the null hypothesis in favor of the alternative.
Recommended video:
Guided course
06:21
Step 1: Write Hypotheses

P-value

The P-value is a crucial component in hypothesis testing that quantifies the strength of evidence against the null hypothesis. It represents the probability of obtaining a test statistic as extreme as, or more extreme than, the observed value, assuming the null hypothesis is true. A smaller P-value indicates stronger evidence against H0, and if it is less than the predetermined significance level (e.g., 0.05), the null hypothesis is typically rejected.
Recommended video:
Guided course
06:50
Step 3: Get P-Value

Chi-Square Test

The Chi-Square test is a statistical method used to assess how well observed data fit an expected distribution. In the context of variance testing, it compares the sample variance to a hypothesized population variance. The test statistic follows a Chi-Square distribution, and the degrees of freedom (DF) are determined by the sample size. This test helps determine if the variability in the sample is significantly different from what is expected under the null hypothesis.
Recommended video:
Guided course
06:34
Step 2: Calculate Test Statistic
Related Practice
Textbook Question

Statistical Literacy and Critical Thinking

In Exercises 1–4, use the results from a Hankook Tire Gauge Index survey of a simple random sample of 1020 adults. Among the 1020 respondents, 86% rated themselves as above average drivers. We want to test the claim that more than 3/4 of adults rate themselves as above average drivers.


Requirements Are the requirements of the hypothesis test all satisfied? Explain.

126
views
Textbook Question

Testing Claims About Proportions

In Exercises 9–32, test the given claim. Identify the null hypothesis, alternative hypothesis, test statistic, P-value, or critical value(s), then state the conclusion about the null hypothesis, as well as the final conclusion that addresses the original claim. Use the P-value method unless your instructor specifies otherwise. Use the normal distribution as an approximation to the binomial distribution, as described in Part 1 of this section.


Births A random sample of 860 births in New York State included 426 boys. Use a 0.05 significance level to test the claim that 51.2% of newborn babies are boys. Do the results support the belief that 51.2% of newborn babies are boys?

123
views
Textbook Question

Testing Claims About Variation

In Exercises 5–16, test the given claim. Identify the null hypothesis, alternative hypothesis, test statistic, P-value, or critical value(s), then state the conclusion about the null hypothesis, as well as the final conclusion that addresses the original claim. Assume that a simple random sample is selected from a normally distributed population.


Bank Lines The Jefferson Valley Bank once had a separate customer waiting line at each teller window, but it now has a single waiting line that feeds the teller windows as vacancies occur. The standard deviation of customer waiting times with the old multiple-line configuration was 1.8 min. Listed below is a simple random sample of waiting times (minutes) with the single waiting line. Use a 0.05 significance level to test the claim that with a single waiting line, the waiting times have a standard deviation less than 1.8 min. What improvement occurred when banks changed from multiple waiting lines to a single waiting line?


6.5 6.6 6.7 6.8 7.1 7.3 7.4 7.7 7.7 7.7

121
views
Textbook Question

Finding Critical Values of (chi)^2 For large numbers of degrees of freedom, we can approximate critical values of as follows:

(chi)^2 = (1/2)(z + sqrt(2k-1))


Here k is the number of degrees of freedom and z is the critical value(s) found from technology or Table A-2. In Exercise 12 “Spoken Words” we have df = 55, so Table A-4 does not list an exact critical value. If we want to approximate a critical value of (chi)^2 in the right-tailed hypothesis test with α = 0.01 and a sample size of 56, we let k =55 with z = 2.33 (or the more accurate value of z = 2.326348 found from technology). Use this approximation to estimate the critical value of for Exercise 12. How close is it to the critical value of (chi)^2 = 82.292 obtained by using Statdisk and Minitab?

235
views
Textbook Question

Testing Claims About Proportions

In Exercises 9–32, test the given claim. Identify the null hypothesis, alternative hypothesis, test statistic, P-value, or critical value(s), then state the conclusion about the null hypothesis, as well as the final conclusion that addresses the original claim. Use the P-value method unless your instructor specifies otherwise. Use the normal distribution as an approximation to the binomial distribution, as described in Part 1 of this section.


Medical Malpractice In a study of 1228 randomly selected medical malpractice lawsuits, it was found that 856 of them were dropped or dismissed (based on data from the Physicians Insurers Association of America). Use a 0.01 significance level to test the claim that most medical malpractice lawsuits are dropped or dismissed. Should this be comforting to physicians?

155
views
Textbook Question

Identifying H0 and H1

In Exercises 5–8, do the following:


a. Express the original claim in symbolic form.

b. Identify the null and alternative hypotheses.


Landline Phones Claim: Fewer than 10% of homes have only a landline telephone and no wireless phone. Sample data: A survey by the National Center for Health Statistics showed that among 16,113 homes, 5.8% had landline phones without wireless phones.

131
views