Problems 11–14 use the information presented in Examples 1 and 2. Find the probability that your friend is no more than 5 minutes late.
Verified step by step guidance
1
Identify the random variable involved, which in this case is the time your friend is late, measured in minutes.
Determine the type of probability distribution that models the lateness time (e.g., normal distribution, uniform distribution, exponential distribution) based on the information given in Examples 1 and 2.
Express the event "no more than 5 minutes late" mathematically as \(X \leq 5\), where \(X\) is the lateness time.
Use the cumulative distribution function (CDF) of the identified distribution to find the probability \(P(X \leq 5)\). This involves substituting 5 into the CDF formula or using a table/calculator if the distribution is standard.
Interpret the result as the probability that your friend arrives on time or within 5 minutes after the expected time.
Verified video answer for a similar problem:
This video solution was recommended by our tutors as helpful for the problem above
Video duration:
2m
Play a video:
0 Comments
Key Concepts
Here are the essential concepts you must grasp in order to answer the question correctly.
Probability
Probability measures the likelihood of an event occurring, expressed as a number between 0 and 1. It helps quantify uncertainty, where 0 means impossible and 1 means certain. In this context, it represents the chance that your friend arrives within a specified time frame.
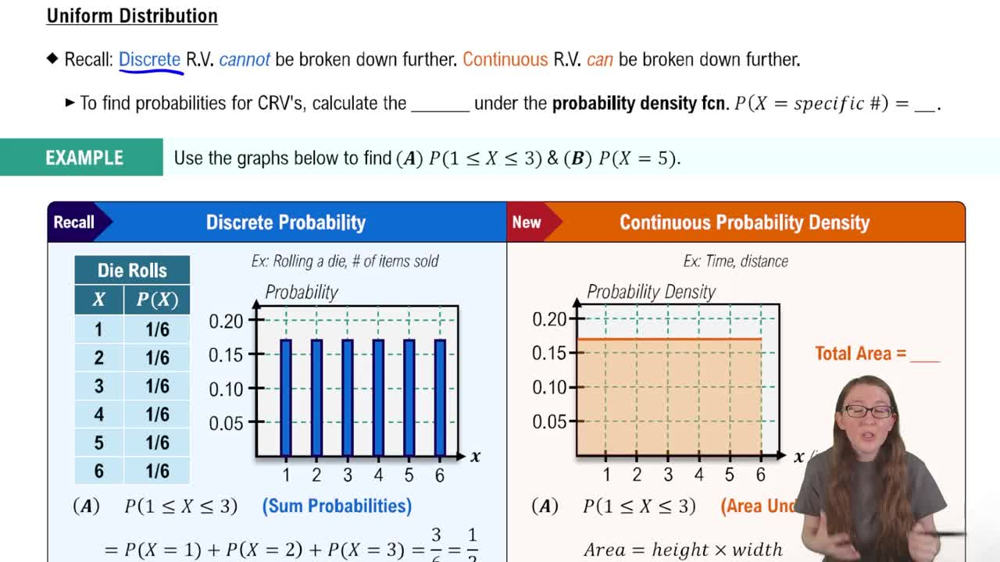
A continuous random variable can take any value within a range, often representing measurements like time or distance. Probabilities for continuous variables are found using areas under probability density functions rather than exact values.
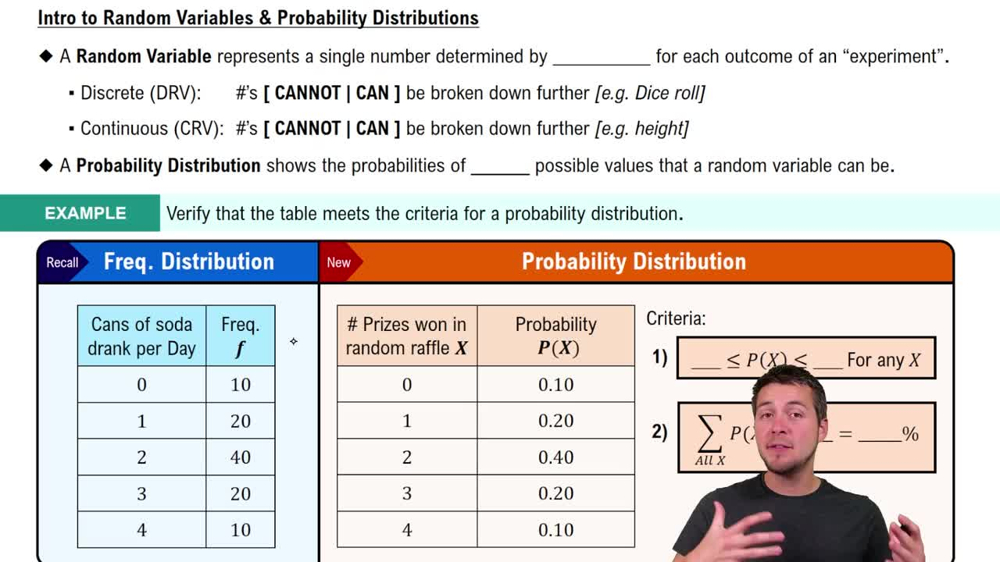
Intro to Random Variables & Probability Distributions
Cumulative Distribution Function (CDF)
The CDF gives the probability that a continuous random variable is less than or equal to a certain value. It is used to find the probability that your friend is no more than 5 minutes late by evaluating the CDF at 5 minutes.

 Verified step by step guidance
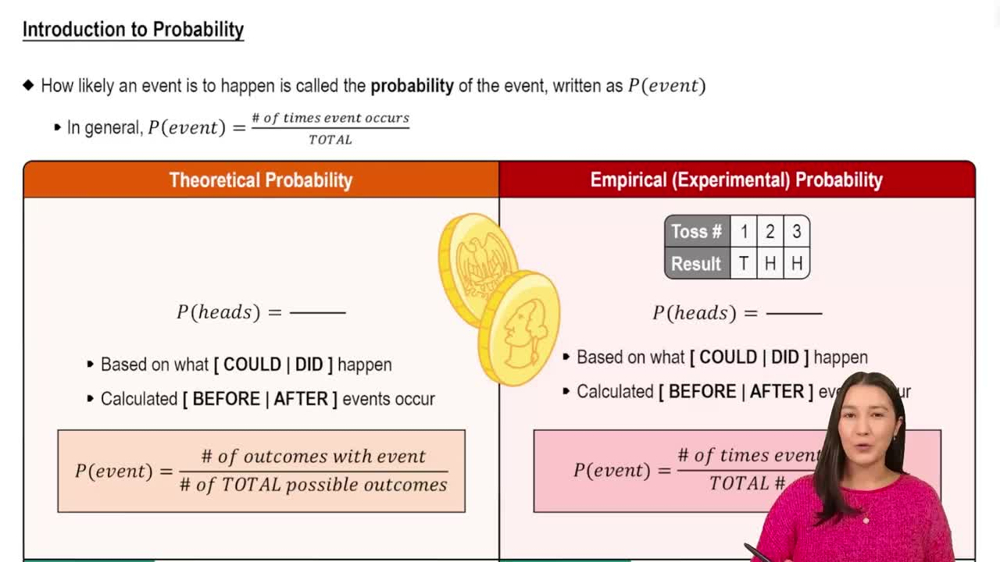
 5:37
5:37