Ch. 6 - Confidence Intervals
Larson - Elementary Statistics: Picturing the World 8th Edition
Larson8th EditionElementary Statistics: Picturing the WorldISBN: 9780137493470Not the one you use?Change textbook
Chapter 6, Problem 6.3.27

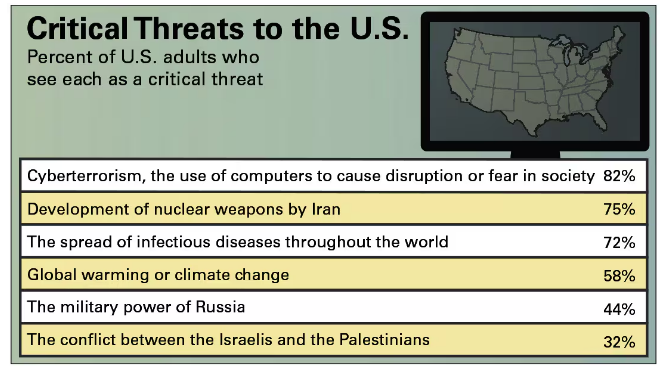
Constructing Confidence Intervals In Exercises 27 and 28, use the figure, which shows the results of a survey in which 1021 U.S. adults were asked whether they see each of the possible threats to the vital interests of the United States as a critical threat in the next 10 years. (Source: Gallup)

Critical Threats Construct a 95% confidence interval for the population proportion of U.S. adults who gave each response.

Verified step by step guidance
1
Step 1: Identify the sample proportion (p̂) for each response. The sample proportion is the percentage of respondents who see each issue as a critical threat divided by 100. For example, for 'Cyberterrorism,' p̂ = 82/100 = 0.82.
Step 2: Determine the sample size (n). The problem states that the survey was conducted with 1021 U.S. adults, so n = 1021.
Step 3: Calculate the standard error (SE) for each response using the formula: SE = sqrt((p̂ * (1 - p̂)) / n). This formula accounts for the variability in the sample proportion.
Step 4: Find the margin of error (ME) for a 95% confidence interval. Use the critical value for a 95% confidence level, which is approximately 1.96 for a standard normal distribution. The formula for ME is: ME = 1.96 * SE.
Step 5: Construct the confidence interval for each response using the formula: Confidence Interval = p̂ ± ME. This will give the range within which the true population proportion is likely to fall with 95% confidence.

Verified video answer for a similar problem:

This video solution was recommended by our tutors as helpful for the problem above.
Video duration:
3m
Was this helpful?

Key Concepts

Here are the essential concepts you must grasp in order to answer the question correctly.

Confidence Interval

A confidence interval is a range of values, derived from sample statistics, that is likely to contain the true population parameter. For example, a 95% confidence interval suggests that if we were to take many samples and construct intervals in the same way, approximately 95% of those intervals would contain the true population proportion. This concept is crucial for estimating the uncertainty around sample estimates.
Recommended video:
06:33
Introduction to Confidence Intervals

Population Proportion

The population proportion refers to the fraction of the entire population that exhibits a certain characteristic. In this context, it represents the percentage of U.S. adults who view specific threats as critical. Understanding this concept is essential for interpreting survey results and constructing confidence intervals, as it provides the target parameter we aim to estimate.
Recommended video:
02:35
Finding a Confidence Interval for a Population Proportion Using a TI84

Sample Size

Sample size is the number of observations or data points collected in a survey or experiment. In this case, the sample size is 1021 U.S. adults. A larger sample size generally leads to more reliable estimates and narrower confidence intervals, as it reduces sampling error. Recognizing the impact of sample size is vital for understanding the precision of the confidence intervals being constructed.
Recommended video:
05:11
Sampling Distribution of Sample Proportion