Table of contents
- 1. Introduction to Biology2h 42m
- 2. Chemistry3h 37m
- 3. Water1h 26m
- 4. Biomolecules2h 23m
- 5. Cell Components2h 26m
- 6. The Membrane2h 31m
- 7. Energy and Metabolism2h 0m
- 8. Respiration2h 40m
- 9. Photosynthesis2h 49m
- 10. Cell Signaling59m
- 11. Cell Division2h 47m
- 12. Meiosis2h 0m
- 13. Mendelian Genetics4h 44m
- Introduction to Mendel's Experiments7m
- Genotype vs. Phenotype17m
- Punnett Squares13m
- Mendel's Experiments26m
- Mendel's Laws18m
- Monohybrid Crosses19m
- Test Crosses14m
- Dihybrid Crosses20m
- Punnett Square Probability26m
- Incomplete Dominance vs. Codominance20m
- Epistasis7m
- Non-Mendelian Genetics12m
- Pedigrees6m
- Autosomal Inheritance21m
- Sex-Linked Inheritance43m
- X-Inactivation9m
- 14. DNA Synthesis2h 27m
- 15. Gene Expression3h 6m
- 16. Regulation of Expression3h 31m
- Introduction to Regulation of Gene Expression13m
- Prokaryotic Gene Regulation via Operons27m
- The Lac Operon21m
- Glucose's Impact on Lac Operon25m
- The Trp Operon20m
- Review of the Lac Operon & Trp Operon11m
- Introduction to Eukaryotic Gene Regulation9m
- Eukaryotic Chromatin Modifications16m
- Eukaryotic Transcriptional Control22m
- Eukaryotic Post-Transcriptional Regulation28m
- Eukaryotic Post-Translational Regulation13m
- 17. Viruses37m
- 18. Biotechnology2h 58m
- 19. Genomics17m
- 20. Development1h 5m
- 21. Evolution3h 1m
- 22. Evolution of Populations3h 52m
- 23. Speciation1h 37m
- 24. History of Life on Earth2h 6m
- 25. Phylogeny2h 31m
- 26. Prokaryotes4h 59m
- 27. Protists1h 12m
- 28. Plants1h 22m
- 29. Fungi36m
- 30. Overview of Animals34m
- 31. Invertebrates1h 2m
- 32. Vertebrates50m
- 33. Plant Anatomy1h 3m
- 34. Vascular Plant Transport1h 2m
- 35. Soil37m
- 36. Plant Reproduction47m
- 37. Plant Sensation and Response1h 9m
- 38. Animal Form and Function1h 19m
- 39. Digestive System1h 10m
- 40. Circulatory System1h 49m
- 41. Immune System1h 12m
- 42. Osmoregulation and Excretion50m
- 43. Endocrine System1h 4m
- 44. Animal Reproduction1h 2m
- 45. Nervous System1h 55m
- 46. Sensory Systems46m
- 47. Muscle Systems23m
- 48. Ecology3h 11m
- Introduction to Ecology20m
- Biogeography14m
- Earth's Climate Patterns50m
- Introduction to Terrestrial Biomes10m
- Terrestrial Biomes: Near Equator13m
- Terrestrial Biomes: Temperate Regions10m
- Terrestrial Biomes: Northern Regions15m
- Introduction to Aquatic Biomes27m
- Freshwater Aquatic Biomes14m
- Marine Aquatic Biomes13m
- 49. Animal Behavior28m
- 50. Population Ecology3h 41m
- Introduction to Population Ecology28m
- Population Sampling Methods23m
- Life History12m
- Population Demography17m
- Factors Limiting Population Growth14m
- Introduction to Population Growth Models22m
- Linear Population Growth6m
- Exponential Population Growth29m
- Logistic Population Growth32m
- r/K Selection10m
- The Human Population22m
- 51. Community Ecology2h 46m
- Introduction to Community Ecology2m
- Introduction to Community Interactions9m
- Community Interactions: Competition (-/-)38m
- Community Interactions: Exploitation (+/-)23m
- Community Interactions: Mutualism (+/+) & Commensalism (+/0)9m
- Community Structure35m
- Community Dynamics26m
- Geographic Impact on Communities21m
- 52. Ecosystems2h 36m
- 53. Conservation Biology24m
50. Population Ecology
Introduction to Population Ecology
Problem 1
Textbook Question
Use this graph of the idealized exponential and logistic growth curves to complete the following.
a. Label the axes and curves on the graph.
b. Give the formula that describes the blue curve.
c. What does the dotted line represent?
d. For each curve, indicate and explain where population growth is the most rapid.
e. Which of these curves best represents global human population growth?


1
Step 1: Label the axes on the graph. The x-axis represents time, while the y-axis represents population size. The blue curve represents exponential growth, and the red curve represents logistic growth.
Step 2: Provide the formula for the blue curve. Exponential growth is described by the formula , where G is the growth rate, r is the per capita rate of increase, and N is the population size.
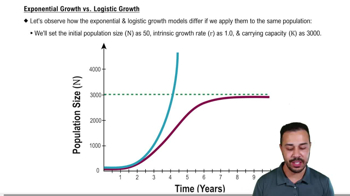
Step 3: Explain the dotted line. The dotted line represents the carrying capacity (K), which is the maximum population size that the environment can sustain indefinitely given the available resources.
Step 4: Indicate where population growth is most rapid for each curve. For the exponential growth curve (blue), population growth is most rapid at the steepest part of the curve, as there are no limiting factors. For the logistic growth curve (red), population growth is most rapid at the midpoint of the curve, where the population size is half of the carrying capacity (K/2). This is because the growth rate slows as the population approaches the carrying capacity.
Step 5: Identify which curve best represents global human population growth. The blue curve (exponential growth) best represents global human population growth, as human populations have historically grown exponentially due to advances in technology, medicine, and agriculture, although some regions may begin to show logistic growth patterns as resources become limiting.

This video solution was recommended by our tutors as helpful for the problem above
Video duration:
2mPlay a video:
Was this helpful?
Key Concepts
Here are the essential concepts you must grasp in order to answer the question correctly.
Exponential Growth
Exponential growth occurs when a population increases at a constant rate, resulting in a J-shaped curve. This type of growth is characterized by rapid population increase when resources are abundant, leading to a doubling effect over time. The formula for exponential growth is G = rN, where G is the growth rate, r is the intrinsic growth rate, and N is the current population size.
Recommended video:
Guided course
Exponential Population Growth
Logistic Growth
Logistic growth describes how a population grows rapidly at first but slows as it approaches the carrying capacity (K) of its environment, resulting in an S-shaped curve. The growth rate decreases as resources become limited, and the population stabilizes around the carrying capacity. The formula for logistic growth is G = rN(K - N)/K, which incorporates the effects of resource limitations.
Recommended video:
Guided course
Exponential Growth vs. Logistic Growth
Carrying Capacity
Carrying capacity (K) is the maximum population size that an environment can sustain indefinitely without degrading the habitat. It is represented by the dotted line in the graph, indicating the point at which population growth levels off in logistic growth. Understanding carrying capacity is crucial for predicting population dynamics and managing resources effectively.
Recommended video:
Guided course
Estimating Earth’s Human Carrying Capacity
Related Videos
Related Practice