Ch. 6 - Confidence Intervals
Larson - Elementary Statistics: Picturing the World 8th Edition
Larson8th EditionElementary Statistics: Picturing the WorldISBN: 9780137493470Not the one you use?Change textbook
Chapter 6, Problem 6.R.1

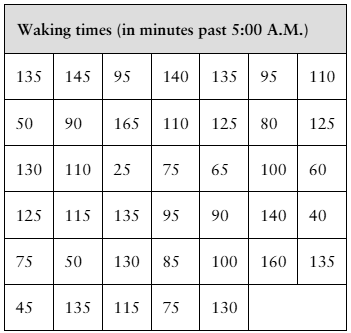
[APPLET] The waking times (in minutes past 5:00 A.M.) of 40 people who start work at 8:00 A.M. are shown in the table at the left. Assume the population standard deviation is 45 minutes. Find (a) the point estimate of the population mean μ and (b) the margin of error for a 90% confidence interval.
tab

Verified step by step guidance
1
Step 1: Calculate the point estimate of the population mean (μ). To do this, compute the sample mean (x̄) by summing all the waking times provided in the table and dividing by the total number of observations (n = 40). Use the formula: x=xn.
Step 2: Identify the population standard deviation (σ), which is given as 45 minutes. This value will be used in the margin of error calculation.
Step 3: Determine the critical value (z*) for a 90% confidence interval. For a 90% confidence level, the z* value corresponds to the area under the standard normal curve. Look up the z* value in a z-table or use statistical software; it is approximately 1.645.
Step 4: Calculate the margin of error (E) using the formula: E=z*σn, where σ is the population standard deviation, n is the sample size, and z* is the critical value.
Step 5: Combine the point estimate (x̄) and margin of error (E) to form the confidence interval. The 90% confidence interval is given by: [x-E,x+E].

Verified video answer for a similar problem:

This video solution was recommended by our tutors as helpful for the problem above.
Video duration:
5m
Was this helpful?

Key Concepts

Here are the essential concepts you must grasp in order to answer the question correctly.

Point Estimate

A point estimate is a single value that serves as an approximation of a population parameter. In this context, the point estimate of the population mean (μ) is calculated by taking the average of the waking times of the sampled individuals. It provides a quick summary of the data, but does not account for variability or uncertainty in the estimate.
Recommended video:
06:33
Introduction to Confidence Intervals

Margin of Error

The margin of error quantifies the uncertainty associated with a point estimate. It indicates the range within which the true population parameter is expected to lie, given a certain confidence level. For a 90% confidence interval, the margin of error is calculated using the standard deviation and the critical value from the z-distribution, reflecting how much the sample mean might differ from the actual population mean.
Recommended video:
04:08
Finding the Minimum Sample Size Needed for a Confidence Interval

Confidence Interval

A confidence interval is a range of values derived from a sample that is likely to contain the true population parameter. It is constructed using the point estimate and the margin of error. For example, a 90% confidence interval means that if we were to take many samples and construct intervals in the same way, approximately 90% of those intervals would contain the true population mean.
Recommended video:
06:33
Introduction to Confidence Intervals