

Ch. 10 - Chi-Square Tests and the F-Distribution
Larson - Elementary Statistics: Picturing the World 8th Edition
Larson8th EditionElementary Statistics: Picturing the WorldISBN: 9780137493470Not the one you use?Change textbook
Chapter 10, Problem 10.RE.8

In Exercises 5–8, (a) find the expected frequency for each cell in the contingency table, (b) identify the claim and state H0 and Ha, (c) determine the degrees of freedom, find the critical value, and identify the rejection region, (d) find the chi-square test statistic, (e) decide whether to reject or fail to reject the null hypothesis, and (f) interpret the decision in the context of the original claim.


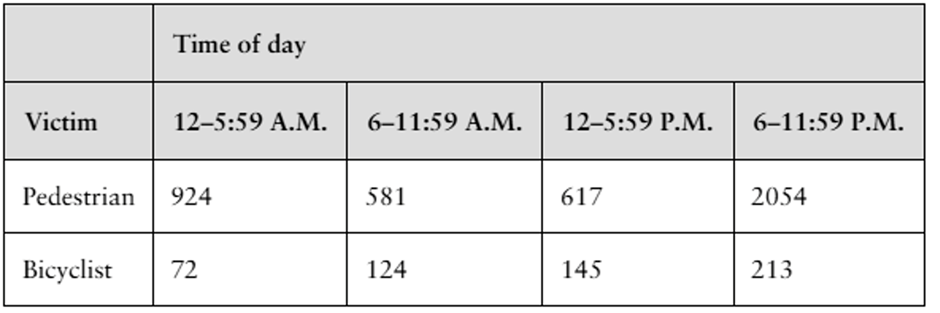
The contingency table shows the distribution of a random sample of fatal pedestrian and bicyclist motor vehicle collisions by time of day in a recent year. At α=0.10, can you conclude that the type of crash victim and the time of day are related? (Adapted from National Highway Traffic Safety Administration)


Contingency table showing fatal pedestrian and bicyclist collisions by time of day, with counts for each victim type.

Verified step by step guidance
1
Step 1: Calculate the expected frequency for each cell in the contingency table. Use the formula for expected frequency: E = (R_i × C_j) / N, where R_i is the row total, C_j is the column total, and N is the grand total.
Step 2: Identify the claim and state the null hypothesis (H_0) and alternative hypothesis (H_a). The null hypothesis is that the type of crash victim and the time of day are independent, while the alternative hypothesis is that they are related.
Step 3: Determine the degrees of freedom using the formula: df = (r - 1)(c - 1), where r is the number of rows and c is the number of columns. Then, find the critical value for the chi-square distribution at α = 0.10 and identify the rejection region.
Step 4: Compute the chi-square test statistic using the formula: χ^2 = Σ((O - E)^2 / E), where O is the observed frequency and E is the expected frequency for each cell.
Step 5: Compare the chi-square test statistic to the critical value. If the test statistic falls in the rejection region, reject the null hypothesis; otherwise, fail to reject it. Finally, interpret the decision in the context of the original claim about the relationship between the type of crash victim and the time of day.

Verified video answer for a similar problem:

This video solution was recommended by our tutors as helpful for the problem above.
Video duration:
6m
Was this helpful?

Key Concepts

Here are the essential concepts you must grasp in order to answer the question correctly.

Contingency Table

A contingency table is a type of data representation that displays the frequency distribution of variables. In this case, it shows the counts of fatal collisions categorized by the type of victim (pedestrian or bicyclist) and the time of day. This format allows for the analysis of the relationship between two categorical variables, which is essential for conducting chi-square tests.
Recommended video:
Guided course
08:18
Contingency Tables & Expected Frequencies

Chi-Square Test

The chi-square test is a statistical method used to determine if there is a significant association between two categorical variables. It compares the observed frequencies in each category of a contingency table to the expected frequencies, which are calculated under the assumption that the variables are independent. The test results in a chi-square statistic that can be compared to a critical value to decide whether to reject the null hypothesis.
Recommended video:
Guided course
07:01
Intro to Least Squares Regression

Null and Alternative Hypotheses

In hypothesis testing, the null hypothesis (H0) represents a statement of no effect or no relationship, while the alternative hypothesis (Ha) suggests that there is an effect or a relationship. For this question, H0 would state that the type of crash victim and the time of day are independent, while Ha would claim that they are related. Formulating these hypotheses is crucial for guiding the analysis and interpreting the results of the chi-square test.
Recommended video:
Guided course
06:21
Step 1: Write Hypotheses
Related Practice
Textbook Question

In Exercises 21 and 22, (c) find the test statistic F, Assume the samples are random and independent, the populations are normally distributed, and the population variances are equal.

[APPLET] The table shows the monthly electric bills (in dollars) for a sample of households from four regions of the United States. At α=0.10, can you conclude that the mean monthly electric bill is different in at least one of the regions? (Adapted from U.S. Energy Information Administration)

39
views
Textbook Question

In Exercises 13–16, find the critical F-value for a two-tailed test using the level of significance α and degrees of freedom d.f.N and d.f.D.


α=0.01,d.f.N=11,d.f.D=13

58
views
Textbook Question

"In Exercises 9–12, find the critical F-value for a right-tailed test using the level of significance α and degrees of freedom d.f.N and d.f.D.


α=0.01,d.f.N=12,d.f.D=10"

53
views
Textbook Question

"In Exercises 17–20, (a) identify the claim and state H₀ and Hₐ, (b) find the critical value and identify the rejection region, (c) find the test statistic F, (d) decide whether to reject or fail to reject the null hypothesis, and (e) interpret the decision in the context of the original claim. Assume the samples are random and independent, and the populations are normally distributed.


A travel consultant claims that the standard deviations of hotel room rates for Sacramento, CA, and San Francisco, CA, are the same. A sample of 36 hotel room rates in Sacramento has a standard deviation of \$51 and a sample of 31 hotel room rates in San Francisco has a standard deviation of \$37. At α=0.10, can you reject the travel consultant’s claim? (Adapted from Expedia)"

38
views
Textbook Question

In Exercises 1–4, (a) identify the claim and state H₀ and Hₐ, (b) find the critical value and identify the rejection region, (c) find the chi-square test statistic, (d) decide whether to reject or fail to reject the null hypothesis, and (e) interpret the decision in the context of the original claim.


A sports website claims that the opinions of golfers about what irritates them the most on the golf course are distributed as shown in the pie chart. You randomly select 1018 golfers and ask them what irritates them the most on the golf course. The table shows the results. At α=0.05, test the sports website’s claim. (Adapted from GOLF.com)


58
views
Textbook Question

In Exercises 13–16, find the critical F-value for a two-tailed test using the level of significance α and degrees of freedom d.f.N and d.f.D.


α=0.01,d.f.N=40,d.f.D=60

63
views