


Ch. 7 - Hypothesis Testing with One Sample
Larson - Elementary Statistics: Picturing the World 8th Edition
Larson8th EditionElementary Statistics: Picturing the WorldISBN: 9780137493470Not the one you use?Change textbook
Chapter 7, Problem 7.3.2

Explain how to use a t-test to test a hypothesized mean mu when sigma is unknown. What assumptions are necessary?

Verified step by step guidance
1
Formulate the null hypothesis (H₀) and the alternative hypothesis (Hₐ). For example, H₀: μ = μ₀ (the population mean is equal to the hypothesized mean) and Hₐ: μ ≠ μ₀ (the population mean is not equal to the hypothesized mean).
Calculate the sample mean (x̄) and the sample standard deviation (s) from the data. These will be used to estimate the population parameters since the population standard deviation (σ) is unknown.
Compute the t-statistic using the formula: t = - μ₀sn, where μ₀ is the hypothesized mean, s is the sample standard deviation, and n is the sample size.
Determine the degrees of freedom (df) for the t-distribution, which is calculated as df = n - 1, where n is the sample size. Use the t-distribution table or statistical software to find the critical t-value for the chosen significance level (e.g., α = 0.05) and the appropriate degrees of freedom.
Compare the calculated t-statistic to the critical t-value. If the absolute value of the t-statistic exceeds the critical t-value, reject the null hypothesis (H₀). Otherwise, fail to reject H₀. Ensure the assumptions of the t-test are met: (1) the data is approximately normally distributed or the sample size is large (Central Limit Theorem), and (2) the data is independent and randomly sampled.

Verified video answer for a similar problem:

This video solution was recommended by our tutors as helpful for the problem above.
Video duration:
5m
Was this helpful?

Key Concepts

Here are the essential concepts you must grasp in order to answer the question correctly.

t-test

A t-test is a statistical method used to determine if there is a significant difference between the means of two groups or between a sample mean and a known value. It is particularly useful when the population standard deviation is unknown and the sample size is small. The t-test calculates a t-statistic, which is then compared to a critical value from the t-distribution to assess significance.
Recommended video:
05:50
Critical Values: t-Distribution

hypothesized mean (mu)

The hypothesized mean (mu) is the value that a researcher expects the population mean to be based on prior knowledge or theory. In hypothesis testing, this value serves as a benchmark against which the sample mean is compared. The goal is to determine whether the sample provides enough evidence to reject the null hypothesis, which posits that the sample mean is equal to the hypothesized mean.
Recommended video:
Guided course
08:24
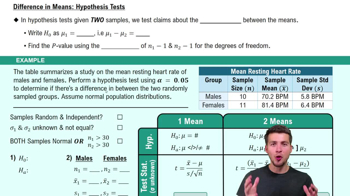
Difference in Means: Hypothesis Tests

assumptions of the t-test

The t-test relies on several key assumptions: the sample data should be drawn from a normally distributed population, the samples should be independent, and the data should be measured at the interval or ratio level. When the sample size is small, the normality assumption becomes particularly important, as violations can affect the validity of the test results.
Recommended video:
Guided course
06:28
Independence Test
Related Practice
Textbook Question

Hypothesis Testing Using Rejection Regions In Exercises 19–26, (a) identify the claim and state H0 and Ha, (b) find the critical value(s) and identify the rejection region(s), (c) find the standardized test statistic t, (d) decide whether to reject or fail to reject the null hypothesis, and (e) interpret the decision in the context of the original claim. Assume the population is normally distributed.


Credit Card Debt A credit reporting agency claims that the mean credit card debt in Colorado is greater than \$5540 per borrower. You want to test this claim. You find that a random sample of 30 borrowers has a mean credit card debt of \$5594 per person and a standard deviation of \$597 per person. At , can you support the claim α=0.05?

138
views
Textbook Question

Explain the difference between the z-test for μ using a P-value and the z-test for μ using rejection region(s).

109
views
Textbook Question

Does failing to reject the null hypothesis mean that the null hypothesis is true? Explain.

397
views
Textbook Question

Writing In a right-tailed test where P < alpha, does the standardized test statistic lie to the left or the right of the critical value? Explain your reasoning.

103
views
Textbook Question

In Exercises 3–8, find the critical value(s) and rejection region(s) for the type of t-test with level of significance alpha and sample size n.


Right-tailed test, α=0.01, n=31

97
views
Textbook Question

Dive Duration An oceanographer claims that the mean dive duration of a North Atlantic right whale is 11.5 minutes. A random sample of 34 dive durations has a mean of 12.2 minutes and a standard deviation of 2.2 minutes. Is there enough evidence to reject the claim at α=0.10?

65
views