3. Functions
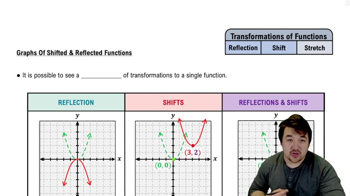
Transformations
3. Functions
Transformations

 5:25
5:25


Showing 9 of 9 videos
Additional 13 creators.
Learn with other creators


Showing 16 of 16 videos
Practice this topic
- Multiple Choice
Written below (green dotted curve) is a graph of the function .If g(x) (blue solid curve) is a reflection of f(x) about the y-axis what is the equation for g(x)?
1025views11rank - Multiple Choice
The green dotted line in the graph below represents the function . The blue solid line represents the function , which is the function after it has gone through a shift transformation. Find the equation for .
1117views9rank - Multiple Choice
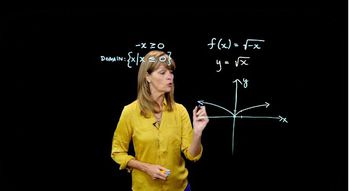
The green dotted curve below is a graph of the function . Find the domain and range of (the blue solid curve), which is a transformation of .
1503views11rank - Multiple ChoiceIn the coordinate plane, triangle has vertices , , and . Triangle is a dilation of about the origin with vertices , , and . What is the scale factor from to ?60views