- Ch. 1 Introduction to Accounting1h 9m
- Ch. 2 Transaction Analysis1h 13m
- Ch. 3 Accrual Accounting Concepts2h 37m
- Accrual Accounting vs. Cash Basis Accounting10m
- Revenue Recognition and Expense Recognition24m
- Introduction to Adjusting Journal Entries and Prepaid Expenses36m
- Adjusting Entries: Supplies12m
- Adjusting Entries: Unearned Revenue11m
- Adjusting Entries: Accrued Expenses12m
- Adjusting Entries: Accrued Revenues6m
- Adjusting Entries: Depreciation15m
- Summary of Adjusting Entries7m
- Unadjusted vs Adjusted Trial Balance6m
- Closing Entries10m
- Post-Closing Trial Balance2m
- Ch. 4 Merchandising Operations2h 30m
- Service Company vs. Merchandising Company10m
- Net Sales28m
- Cost of Goods Sold - Perpetual Inventory vs. Periodic Inventory9m
- Perpetual Inventory - Purchases10m
- Perpetual Inventory - Freight Costs9m
- Perpetual Inventory - Purchase Discounts11m
- Perpetual Inventory - Purchasing Summary6m
- Periodic Inventory - Purchases14m
- Periodic Inventory - Freight Costs7m
- Periodic Inventory - Purchase Discounts10m
- Periodic Inventory - Purchasing Summary6m
- Single-step Income Statement4m
- Multi-step Income Statement17m
- Comprehensive Income2m
- Ch. 5 Inventory1h 55m
- Merchandising Company vs. Manufacturing Company6m
- Physical Inventory Count, Ownership of Goods, and Consigned Goods10m
- Specific Identification7m
- Periodic Inventory - FIFO, LIFO, and Average Cost23m
- Perpetual Inventory - FIFO, LIFO, and Average Cost31m
- Financial Statement Effects of Inventory Costing Methods10m
- Lower of Cost or Market11m
- Inventory Errors14m
- Ch.6 Internal Controls and Reporting Cash1h 16m
- Ch. 7 Receivables and Investments3h 16m
- Types of Receivables8m
- Net Accounts Receivable: Direct Write-off Method5m
- Net Accounts Receivable: Allowance for Doubtful Accounts13m
- Net Accounts Receivable: Percentage of Sales Method9m
- Net Accounts Receivable: Aging of Receivables Method11m
- Notes Receivable25m
- Introduction to Investments in Securities13m
- Trading Securities31m
- Available-for-Sale (AFS) Securities26m
- Held-to-Maturity (HTM) Securities17m
- Equity Method33m
- Ch. 8 Long Lived Assets5h 6m
- Initial Cost of Long Lived Assets42m
- Basket (Lump-sum) Purchases13m
- Ordinary Repairs vs. Capital Improvements10m
- Depreciation: Straight Line32m
- Depreciation: Declining Balance33m
- Depreciation: Units-of-Activity28m
- Depreciation: Summary of Main Methods8m
- Depreciation for Partial Years13m
- Retirement of Plant Assets (No Proceeds)14m
- Sale of Plant Assets18m
- Change in Estimate: Depreciation21m
- Intangible Assets and Amortization17m
- Natural Resources and Depletion16m
- Asset Impairments16m
- Exchange for Similar Assets16m
- Ch.9 Current Liabilities2h 19m
- Ch. 10 Time Value of Money1h 27m
- Ch. 11 Long Term Liabilities2h 45m
- Ch. 12 Stockholders' Equity2h 15m
- Characteristics of a Corporation17m
- Shares Authorized, Issued, and Outstanding9m
- Issuing Par Value Stock12m
- Issuing No Par Value Stock5m
- Issuing Common Stock for Assets or Services8m
- Retained Earnings14m
- Retained Earnings: Prior Period Adjustments9m
- Preferred Stock11m
- Treasury Stock9m
- Dividends and Dividend Preferences17m
- Stock Dividends10m
- Stock Splits9m
- Ch. 13 Statement of Cash Flows2h 24m
- Ch. 14 Financial Statement Analysis5h 25m
- Horizontal Analysis14m
- Vertical Analysis21m
- Common-sized Statements5m
- Trend Percentages7m
- Discontinued Operations and Extraordinary Items6m
- Introduction to Ratios8m
- Ratios: Earnings Per Share (EPS)10m
- Ratios: Working Capital and the Current Ratio14m
- Ratios: Quick (Acid Test) Ratio12m
- Ratios: Gross Profit Rate9m
- Ratios: Profit Margin7m
- Ratios: Quality of Earnings Ratio8m
- Ratios: Inventory Turnover10m
- Ratios: Average Days in Inventory9m
- Ratios: Accounts Receivable (AR) Turnover9m
- Ratios: Average Collection Period (Days Sales Outstanding)8m
- Ratios: Return on Assets (ROA)8m
- Ratios: Total Asset Turnover5m
- Ratios: Fixed Asset Turnover5m
- Ratios: Profit Margin x Asset Turnover = Return On Assets9m
- Ratios: Accounts Payable Turnover6m
- Ratios: Days Payable Outstanding (DPO)8m
- Ratios: Times Interest Earned (TIE)7m
- Ratios: Debt to Asset Ratio5m
- Ratios: Debt to Equity Ratio5m
- Ratios: Payout Ratio5m
- Ratios: Dividend Yield Ratio9m
- Ratios: Return on Equity (ROE)10m
- Ratios: DuPont Model for Return on Equity (ROE)20m
- Ratios: Free Cash Flow10m
- Ratios: Price-Earnings Ratio (PE Ratio)7m
- Ratios: Book Value per Share of Common Stock7m
- Ratios: Cash to Monthly Cash Expenses8m
- Ratios: Cash Return on Assets7m
- Ratios: Economic Return from Investing6m
- Ratios: Capital Acquisition Ratio6m
- Ch. 15 GAAP vs IFRS56m
- GAAP vs. IFRS: Introduction7m
- GAAP vs. IFRS: Classified Balance Sheet6m
- GAAP vs. IFRS: Recording Differences4m
- GAAP vs. IFRS: Adjusting Entries4m
- GAAP vs. IFRS: Merchandising3m
- GAAP vs. IFRS: Inventory3m
- GAAP vs. IFRS: Fraud, Internal Controls, and Cash3m
- GAAP vs. IFRS: Receivables2m
- GAAP vs. IFRS: Long Lived Assets5m
- GAAP vs. IFRS: Liabilities3m
- GAAP vs. IFRS: Stockholders' Equity3m
- GAAP vs. IFRS: Statement of Cash Flows5m
- GAAP vs. IFRS: Analysis and Income Statement Presentation5m
- Ch. 16 Introduction to Managerial Accounting1h 36m
- Ch. 17 Job Order Costing42m
- Ch. 18 Process Costing1h 1m
- Ch. 19 Cost Behavior1h 27m
- Ch. 20 Cost-Volume-Profit-Analysis1h 25m
- Ch. 21 Variable Costing29m
- Ch. 22 Activity-Based Costing43m
- Ch. 23 The Master Budget3h 56m
- Introduction to Budgeting4m
- Benefits of Budgeting4m
- Types of Budgets7m
- Overview of Master Budgeting11m
- Sales Budget14m
- Production Budget21m
- Direct Materials Budget23m
- Direct Labor Budget8m
- Manufacturing Overhead Budget11m
- Ending Finished Goods Inventory Budget11m
- Operating Expenses Budget9m
- Capital Expenditures Budget7m
- Cash Budget1h 1m
- Budgeted Income Statement9m
- Budgeted Balance Sheet31m
- Ch. 24 Flexible Budgets40m
- Ch. 25 Standard Costs and Variances34m
The Contribution Approach Income Statement: Videos & Practice Problems
The Contribution Approach Income Statement, also called the contribution margin income statement, reorganizes the income statement to separate variable costs from fixed costs. This format starts with sales, subtracts variable costs to find the contribution margin, and then subtracts fixed costs to arrive at net operating income. The key relationship is \( \text{Contribution Margin} = \text{Sales} - \text{Variable Costs} \)
This approach shows how much sales revenue is available first to cover fixed costs and then, if any remains, to become income. Variable costs are treated as the first costs that must be covered because they support continued production or service in future periods. After variable costs are paid, the remaining amount contributes toward fixed costs, and any excess becomes net operating income.
Unlike a standard income statement, which emphasizes product costs and period costs, the contribution approach is designed for internal decision making. Its value comes from clearly showing cost behavior, helping managers understand how changes in sales and costs affect profitability while still arriving at the same final income as a traditional income statement.
Introduction to the Contribution Margin


Introduction to the Contribution Margin
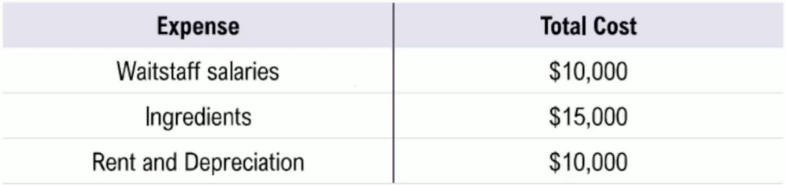
Taco Table is a restaurant with costs listed in the table below. If Taco Table sells 10,000 tacos for \$4 each, what is their contribution margin?
\$10,000
\$15,000
\$20,000
\$25,000
The Contribution Margin Income Statement
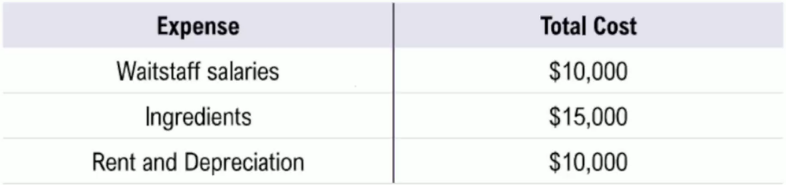
Taco Table is a restaurant with costs listed in the table below. If Taco Table sells 10,000 tacos for \$4 each, what is Taco Table’s net operating income as calculated on a Contribution Margin Income Statement.
\$5,000
\$10,000
\$15,000
\$20,000
Here's what students ask on this topic:
The contribution margin is a key figure in the contribution approach income statement. It represents the amount of sales revenue remaining after subtracting all variable costs. Mathematically, it is expressed as . This margin shows how much money is available to cover fixed costs and then contribute to net operating income. Variable costs are deducted first because they are essential for ongoing production. The contribution margin helps managers understand how sales affect profitability and supports internal decision-making by clearly separating variable and fixed costs.
The contribution margin income statement differs from a standard income statement primarily in how costs are classified and presented. While a standard income statement groups costs into product costs (cost of goods sold) and period costs (selling and administrative expenses), the contribution margin income statement separates costs based on behavior: variable costs and fixed costs. It starts with sales, subtracts variable costs to find the contribution margin, and then subtracts fixed costs to arrive at net operating income. This format is designed for internal decision-making, providing clearer insight into how costs behave and how changes in sales impact profitability, even though both statements ultimately report the same net income.
Variable costs are deducted before fixed costs in the contribution approach because they are directly tied to production and must be paid to continue operations. If a business fails to cover its variable costs, it cannot produce goods or services in future periods. For example, a company must pay suppliers for raw materials to maintain production. Therefore, variable costs are considered the first priority. After covering variable costs, the remaining contribution margin is used to cover fixed costs, which do not change with production volume. This order helps managers understand the financial impact of sales on covering essential costs and generating income.
The contribution margin income statement assists managerial decision-making by clearly separating variable and fixed costs, which helps managers analyze how changes in sales volume affect profitability. By focusing on the contribution margin, managers can determine how much revenue is available to cover fixed costs and generate profit. This insight supports decisions such as pricing, cost control, and product mix. Unlike the standard income statement, which is designed for external reporting, the contribution margin format provides detailed cost behavior information that is valuable for internal planning and control.
No, the contribution margin income statement does not report a different net income than the standard income statement. Both statements start with the same sales figure and ultimately arrive at the same net operating income. The difference lies in how costs are presented: the contribution margin income statement separates variable and fixed costs to highlight cost behavior, while the standard income statement groups costs as product and period costs. The contribution margin format is primarily used for internal decision-making, providing managers with useful insights without changing the final income reported.