Table of contents
- 1. Introduction to Macroeconomics2h 3m
- 2. Introductory Economic Models1h 9m
- 3. Supply and Demand3h 23m
- Introduction to Supply and Demand4m
- The Basics of Demand6m
- Individual Demand and Market Demand3m
- Shifting Demand38m
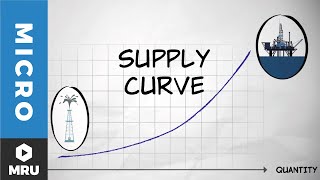
- The Basics of Supply2m
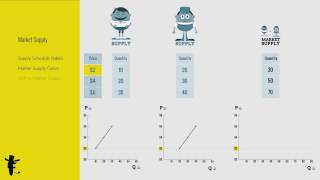
- Individual Supply and Market Supply6m
- Shifting Supply28m
- Overview of Supply and Demand Shifts7m
- Supply and Demand Together: Equilibrium, Shortage, and Surplus8m
- Supply and Demand Together: One-sided Shifts20m
- Supply and Demand Together: Both Shift34m
- Supply and Demand: Quantitative Analysis40m
- 4. Elasticity2h 25m
- Percentage Change and Price Elasticity of Demand18m
- Elasticity and the Midpoint Method20m
- Price Elasticity of Demand on a Graph11m
- Determinants of Price Elasticity of Demand6m
- Total Revenue Test13m
- Total Revenue Along a Linear Demand Curve14m
- Income Elasticity of Demand23m
- Cross-Price Elasticity of Demand11m
- Price Elasticity of Supply12m
- Price Elasticity of Supply on a Graph3m
- Elasticity Summary9m
- 5. Consumer and Producer Surplus; Price Ceilings and Price Floors3h 11m
- WIllingness to Pay and Consumer Surplus18m
- Willingness to Sell and Producer Surplus12m
- Economic Surplus and Efficiency18m
- Quantitative Analysis of Consumer and Producer Surplus at Equilibrium28m
- Price Ceilings, Price Floors, and Black Markets38m
- Quantitative Analysis of Price Ceilings and Floors: Finding Points20m
- Quantitative Analysis of Price Ceilings and Floors: Finding Areas54m
- 6. Introduction to Taxes1h 29m
- 7. Externalities54m
- 8. The Types of Goods1h 3m
- 9. International Trade1h 16m
- 10. Measuring National Output and Income 54m
- 11. Unemployment and Inflation1h 34m
- Labor Force and Unemployment10m
- Types of Unemployment12m
- Unemployment: Minimum Wage Laws and Efficiency Wages7m
- Inflation and Consumer Price Index (CPI)16m
- Using CPI to Adjust for Inflation7m
- Problems with the Consumer Price Index (CPI)5m
- Nominal Income and Real Income12m
- Nominal Interest, Real Interest, and the Fisher Equation5m
- Who is Affected by Inflation?5m
- Demand-Pull and Cost-Push Inflation6m
- Costs of Inflation: Shoe-leather Costs and Menu Costs4m
- 12. Productivity and Economic Growth1h 4m
- 13. The Financial System1h 30m
- 14. Income and Consumption57m
- 15. Deriving the Aggregate Expenditures Model1h 14m
- 16. Aggregate Demand and Aggregate Supply Analysis1h 22m
- Aggregate Demand17m
- Deriving Aggregate Demand from the Aggregate Expenditure Model12m
- Shifting Aggregate Demand4m
- Long Run Aggregate Supply9m
- Short Run Aggregate Supply7m
- Shifting Short Run Aggregate Supply8m
- AD-AS Model: Equilibrium in the Short Run and Long Run5m
- AD-AS Model: Shifts in Aggregate Demand18m
- 17. The Monetary System58m
- The Functions of Money; The Kinds of Money8m
- Defining the Money Supply: M1 and M22m
- Required Reserves and the Deposit Multiplier8m
- Introduction to the Federal Reserve8m
- The Federal Reserve and the Money Supply11m
- History of the US Banking System9m
- The Financial Crisis of 2007-2009 (The Great Recession)10m
- 18. Monetary Policy1h 26m
- 19. Fiscal Policy52m
- 20. Tradeoffs Between Inflation and Unemployment1h 2m
- 21. Open-Economy Macroeconomics1h 44m
- Balance of Payments: Introduction5m
- Balance of Payments: Current Account8m
- Balance of Payments: Financial Account and Capital Account7m
- Net Exports Equal Net Foreign Investment7m
- Balance of Trade; Trade Deficit and Trade Surplus6m
- Exchange Rates: Introduction14m
- Exchange Rates: Nominal and Real13m
- Exchange Rates: Equilibrium8m
- Exchange Rates: Shifts in Supply and Demand11m
- Exchange Rates and Net Exports6m
- Exchange Rates: Purchasing Power Parity3m
- The Gold Standard4m
- The Bretton Woods System6m
- 22. Macroeconomic Schools of Thought40m
- 23. Dynamic AD/AS Model32m
3. Supply and Demand
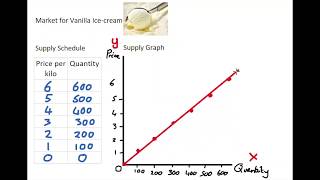
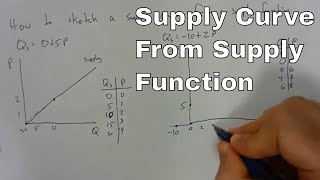
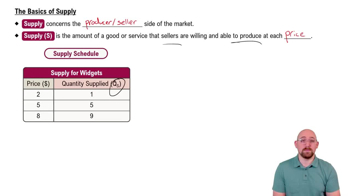
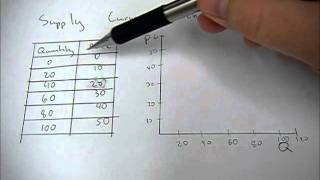
The Basics of Supply


The Basics of Supply
Brian Krogol
Video duration:
3mPlay a video:
Related Videos
 03:14
03:14