In market economics, understanding the full benefits created by trade requires analyzing both consumer and producer perspectives. While consumer surplus measures the benefit consumers receive when purchasing a product below their maximum willingness to pay, producer surplus captures the benefit producers gain when selling a product above their minimum willingness to sell. The willingness to sell represents the lowest price at which a producer is willing to offer a product, typically aligned with the cost of production. For example, if it costs \$5 to produce an item, a producer will not sell it for less than \$5, as that would result in a loss.
Producer surplus is calculated as the difference between the market price and the producer’s willingness to sell, expressed mathematically as:
\[\text{Producer Surplus} = \text{Price} - \text{Willingness to Sell}\]
This formula highlights a key economic insight: as market prices increase, producer surplus also increases, which contrasts with consumer surplus that decreases with rising prices. For instance, if the market price is \$2 and a producer’s willingness to sell is \$1, the producer surplus is \$1. However, if the willingness to sell exceeds the market price, producers will opt not to sell, ensuring that producer surplus never becomes negative.
When the price rises to \$4, producers with willingness to sell below \$4 benefit from increased surplus. A producer willing to sell at \$1 now gains a surplus of \$3, while another willing to sell at \$3 gains \$1. Producers with willingness to sell above \$4 still refrain from selling, maintaining the principle that sales only occur when profitable.
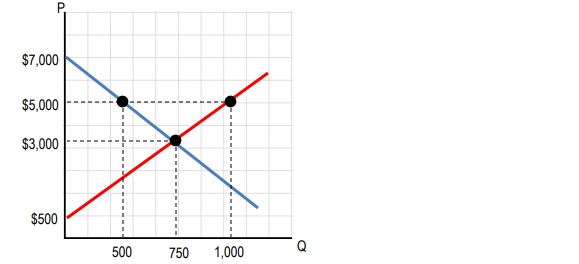
This concept of producer surplus is closely linked to the supply curve, which graphically represents the relationship between price and quantity supplied. Each point on the supply curve corresponds to a producer’s willingness to sell at a given price, and the area above the supply curve and below the market price represents total producer surplus in the market. Understanding producer surplus alongside consumer surplus provides a comprehensive view of the economic welfare generated by market transactions.