Externalities
Public Solutions to Externalities
1
concept
Public Solutions to Externalities:Command-and-Control Policies and Corrective Pigovian Taxes and Subsidies
16m
Play a video:
Was this helpful?
now let's see how the government can step in and help provide solutions to externalities. So we saw these externalities, right? These are costs or benefits that are put on people outside the transaction. Right? So we'll see things like pollution will see vaccinations, right? Less contagious populations, things like that. So what we're gonna see now, right? We had those graphs where there was these extra costs or extra benefits not included into the market. Um, and what we wanna do is we want to internalize these externalities. Right? So this is a phrase that we use in and when we say internalized, we want to bring that cost or that benefit from the externality into the market transaction. Right? So we want the people in the transaction to be accounting for this extra cost or benefit. Okay. So it's gonna force that full cost or benefit into the market transaction. Okay. And we're gonna see this um, for public solutions as well as private. Once we get to private solutions in other videos, we're gonna be internalizing these externalities. Okay, So let's see how the government can step in and do that. The first type of thing the government can do is this command and control policies. This is where the government just puts its foot down and says you got to do this or you can't do this, right? It just makes a law. This is the way it's gotta be done. They're gonna require or forbid certain behavior. Right? So on the positive side, right? And the idea of a positive externality. We've been talking about education, um, having these external benefits, right? And the market itself isn't gonna take account for these external benefits. So the government steps in and says, hey, everybody's gotta get educated, right? You're gonna force this grade school education on everybody because it knows that there's gonna be this benefit to society by educating these people, Right? Um So that's kind of a commanding control, right, requiring the education. Or how about on the other side, right, In this negative externality, right? Where there's this dumping of chemicals into a river by a by a factory or something, the government can just step in and say, hey, you're not allowed to do that. You're not allowed to dump chemicals in the river, and then they're gonna have to figure out some way to safely get rid of the chemicals, right? They're gonna take on the cost to like safely dispose of the chemicals. Or the government could also require maybe some sort of, like, filter system be installed, that gets rid of the chemicals as well. In either case, right? The company now has to take on the cost of dealing with those chemicals. Right? So that's the first way the government can can take, take action, right? They just say, this is the way it's gotta be, or the government can um instill these market based policies. Right? So, before the government was command and control, in this case, the governments either gonna implement these corrective taxes. So they're gonna put in a tax or subsidy, um or they're gonna have these quantity limits, they're gonna set a limit on on quantity. Okay, So we're gonna talk about both of these. We're gonna talk first in this video, we'll spend most of our time talking about these corrective taxes and subsidies. Okay, so let's go ahead and jump into that. And that's gonna be most of the graphs here. Alright, so, um let's start here with these corrective taxes. And what they're also called is these pig, avian taxes? The reason they have this name is because there was this guy, Vigo who won a Nobel prize for figuring this out. He won a nobel prize for figuring out how taxes and subsidies can help us solve problems with externalities. So, his idea, his Nobel prize winning idea was to impose a tax or a subsidy equal to the amount of the externality. So, you can imagine if we can if we can quantify this externality, what is the cost of this pollution to society or what is the benefit of this education, we can essentially put in a tax or a subsidy to get us to that correct quantity. Right. So what we've seen when we first started talking about these uh these externalities on the graph, we saw that we were we were not efficient, right? We were at some point where we were overproducing or under producing because we weren't taking into account full costs and full benefit to society, right? So first, in this negative externality case, right? We had the idea that um if this was our demand curve. D. One and this was S. One up here, right? This represented those private costs, right? This was the the supply curve that we're used to right that it's just the cost the supplier takes into account when he when he produces the paper. However, when we think all the costs, we include the cost of the pollution, right? It could send us somewhere out here, Right? Let's say that was the cost of the pollution um to society. That extra cost is added in there now. So that takes us to S. Two, which was our marginal social cost curve, right? And on that marginal social cost curve, all of our costs are included. So, we found that our true equilibrium should have been over here, right? This should have been the equilibrium and this should have been the quantity of paper produced. Um over here. Q. Star where the market was producing here at Q. I'm gonna put em for market right? The market was producing this this higher quantity. So what can the government do to get us down to that quantity? Right. We were talking about taxes and subsidies in this case. A tax a tax is excuse me, is what's gonna get us to this quantity. So if you guys remember from when we were talking about taxes, taxes are gonna lower our quantity, right? Um and that's because the tax puts this difference between the price the buyers pay and the price the sellers receive. So if we were to put a tax in right here equal to the amount of the pollution, the cost of pollution, which by the way, the difference between these two curves right here, this length, this is the cost of the pollution cost of pollution, right? That's that external cost. Is that difference between those two curves? Because that first curve had all our other costs and then we just added one cost, the cost of pollution and it got us to that other curve. Cool. So this green line I just drew represents an amount of tax, right? So if we were to take this to R r r axis, right? If you guys remember correctly, um when we talked about taxes, we would have this price the buyers pay up here and the price the sellers receive, Right? And that difference between the two is the amount of the tax, right? That was the amount of the tax. And then we had this box, that was the tax revenue over here. Right? So that tax um Now look what it's essentially done. It's shifted us down to this equilibrium quantity right here, right? And that's where we want to be. This is the efficient quantity that takes into the account that cost of um that cost of the pollution, right? And now what you can see also, right, you were thinking when we talked about taxes, we had these deadweight losses and stuff, but we could also have the situation that these taxes could, you know, maybe further um further benefit people, you know, further lower pollution, right? They use that tax revenue for environmental causes or something. That that could be an even better way to to use the money. So in this case, you see that this tax, right? We took a tax in the amount of the pollution uh in the in the amount of the cost of the pollution. And it and it led us to this equilibrium quantity right now, I want to make a point real quick because in this case it's not like we got rid of pollution altogether, right? We've got we found this equilibrium amount of pollution, right? Which is kind of weird. Some of you might be thinking pollution is bad, right? We need to get rid of all pollution. But when we think of this from an economic standpoint, we gotta think of our benefits and our costs that we get from pollution, right? There's gonna be some point where like that first little bit of pollution that we put into the environment, like doesn't have a big effect, but we get a lot of benefit from it, right? Maybe this pollution, you know, helps us make lifesaving vaccines or it gives us some of these modern luxuries that we have that, you know, even being to get around in cars, right? Yes, we're polluting. But it makes us a lot more efficient. So maybe we have too many cars, right? We're over producing cars. But there is some level that is going to be efficient, right? So it's not that we should have zero pollution. I know there's some of you out there, I feel the same way. But the idea here when we're in this class, if you don't want to fail, the idea is we got to have some pollution right to stay efficient and and maximize um some of our benefits here. Okay. So that's what we see here in the negative externality is this tax is gonna get us down to this equilibrium quantity. So what do you think is gonna happen with a positive externality? We're gonna have opposite things going on here. So let's go ahead and do that. Um here, we've got just like we saw before we've got our d. one and Rs one, right? But in this case we're talking about education, having this positive effect on the rest of the population, right? So what we saw was we're gonna shift our demand curve to the right here, right? Because we've got extra benefits. So this D one was our private benefits, right? It only included uh what you consider when you go to college those benefits you're gonna get from going to college where D. Two includes your benefits. Um But also um the benefits to society. So marginal social benefit includes all benefits. Let me get out of the way here so we can see the whole graph. Alright, so let's go ahead and do the same thing in this case. Um We should be over here, right? This is our true equilibrium up here where we should have been producing here at Q star, right? But the market will only by itself produce here at Q. M. Right? Because it's not taking into account that extra benefit PM over here. Right. Well we're gonna do the same thing with prices. So let's go ahead and let's talk about that. So in this case, right, we had the tax, excuse me, the tax get us to the equilibrium quantity that was lower. In this case the government wants to help us produce more, right? Because we're under producing the government wants to help us produce more. So the government's gonna subsidize this market, they're gonna give money into the market to get us up to that equilibrium quantity, right? That efficient, socially optimum optimal quantity, right? And they're gonna do that by subsidizing in this case. This green line represents the subsidy, right? So just like before this difference between the red curve, the marginal social benefit and the private benefit, that is the benefit to society, right? That productivity benefit benefit to society. I'm gonna put, right, that's that productivity benefit, it's equal to that amount we've quantified the amount of the benefit. Um So let's go ahead and see what happens here, right? When we have subsidies, what we're gonna see is again, we have a different price for the buyer and the seller, right? So we're gonna see that in this case um the price the buyers pay is gonna be somewhere down here, right? The buyers where it touches the demand curve is down there and the supply curve is up here, right? Price the sellers receive. Right? So in this case the sellers received more than the buyers pay because this government is subsidizing, right? So the difference between these two is the amount of the subsidy subsidy, right? That's the difference between those two prices there. Um So what you'll see is that in this case, this subsidy helped us reach this efficient quantity, right? By by subsidizing this market, the government has gotten us essentially to that efficient quantity and helped us internalize that externality. Right now, the market is taking into account uh that extra benefit because of the subsidy. So it gets us to that equilibrium quantity. Um and that is the nobel prize winning idea that Vigo had. Right? So I want to look at one more graph in this video before we move on and it's this one on the left here, this pig avian corrective tax on the left. So this is another way to think of the same idea in this graph, we have a price of pollution there's space for me. So I'm gonna come in over here in the corner. So this graph, instead of talking about the paper company, right, the quantity of paper and the price of paper, we can think of pollution on the graph right now, there's gonna be this demand for the right to pollute, right? Um So the idea is if we put in this tax, write this tax is kind of the cost of polluting, right? So if we can set the tax at the correct amount, we can get the pollution the demand for pollution rights where we want them, Right? So, our goal here, as the government is to first identify hate pollution is an external cost in this business. So how much is that affecting people? And then they're gonna try and uh align the demand for this pollution with the tax that they put. So if this was the demand for pollution rights here on this blue curve, the government could set this corrective tax to get this amount of quantity demanded right of pollution rights. So this would be the equilibrium quantity of pollution rights, and maybe that's the amount that the government wanted, right, This is the correct amount of pollution, um like our discussion before, right, there's some amount that's going to be beneficial to society, right? So, if that's the efficient amount, this could be the correct tax, right? So this is the amount of the tax right here. So notice we've got the price of pollution and quantity of pollution. So, for each, let's say, a ton of pollution, you're gonna have to pay this tax. Okay, so we're still talking about that same tax situation, right? Because up here, we had this amount of tax right here, and this amount, whatever amount it is, let's say it's a $10 tax. That is what we're seeing here, right? This is that $10 tax right here. So, if we say this $10 tax and we line it up to the amount of pollution. That's correct. We're going to get the correct quantity of pollution, right? So, what if they had set the tax too high, right? If they had this like high tax of $12, they're gonna end up with this lower amount of pollution, right? This low quantity of pollution, which some of you might be thinking, hey, that's a good idea. But in essence, right there, is this this correct amount of pollution, and we're too low at this point, right? We could still be getting benefits from polluting a little more. The benefits can still outweigh the cost of a little more pollution, Right? So, if the tax is too high, we're not gonna have enough pollution, right? We're not gonna be getting all the benefits, we could, the tax was too low, we would have too much pollution, right? The demand for those pollution rights would be way over here, and we would have way too much pollution would be polluting more uh than the equilibrium amount. Right? So, we'll talk about that last graph in the video and we'll see how this compares. But that's the idea here, Right? We took that idea of the tax and we we basically moved it to kind of a new market, right? The market for pollution, the market for the right to pollute. So that amount of tax, if we find the correct amount of tax, we can find the correct amount of pollution. Alright, so that kind of just takes that same idea from up here, and it moves it onto a graph dealing with just pollution there. Alright, so let's go ahead and compare that idea of the tax with what we can do with a quantity limitation. Alright, so the quantity limitation is the other way that the government can be, can step in and um provide solutions to these externalities. Right? So, we saw right here in this video, we're dealing mostly with this step one, right? These corrective taxes and subsidies. So, it's going to the next video and talk about these quantity limits and compare it to these tax subsidies, taxes, and subsidies. Alright, let's do that. Now
2
concept
Public Solutions to Externalities:Quantity Limits
4m
Play a video:
Was this helpful?
All right? So, the other solution of government can provide here in the market is a quantity limitation. Right? So this is number two from above, right. We had, we talked about in the previous video, we were talking about uh these corrective taxes and subsidies. Now let's talk about the quantity limits, right? # two there. Um And that's gonna be this idea of these pollution permits, Right? So what we've noticed so far is that there's gonna be some amount of pollution that is efficient for society, right? There's gonna be this equilibrium amount of pollution. And we saw how we could deal with that with taxes, right? On the left hand side here, we have the idea of a tax being put into this market for pollution rights, right? And this tax was the amount that we thought was correct from from our our graph above where we put our marginal social costs, right? This this tax was the amount that got us to the efficient amount of pollution. But there's another way to get there too. Right? If the government can estimate the amount of pollution, if they say, Hey, the correct equilibrium amount of pollution is 10,000 tons of pollution a year or whatever. I don't know this 10,000 tons that they set if that's the amount they want. Well then they could just make permits that they can sell, right? They can sell 10,000 permits that each give you the right for one ton of pollution. Right? So there's one ton, it's like almost like you have a money, pollution money, Right? So there's gonna be these 10,000 permits that allow you to pollute one ton of of pollution and that's going to be this equilibrium quantity here. Q. Star right? This Cousteau That is that quantity that the government thought was the equilibrium. So they're gonna allow pollution permits up to that amount and that's gonna be the supply. That's why you see this perfectly vertical line is because that is the supply of pollution permits. There are 10,000 pollution permits regardless of the price. Right? There's gonna be this exact quantity. 10,000 pollution permits. Alright. So at this quantity of 10,000 pollution permits, regardless of price. Right? This is our price axis and our quantity axis. Um what is gonna happen is we're going to find the place where that 10,000 uh 10,000 pollution permits touches our demand curve. And we're gonna get a price for these pollution permits, right? And this price should ideally be the same amount of the tax. So we would expect from our example that these would end up being $10 right over in our previous on the left. We we ended up kind of using this number, right? That $10 was the correct amount of tax per amount of pollution. So in this case we have the same demand curve except now we just set the quantity limit and the price is what what got uh found out in the market. So you could imagine that there's going to be different companies buying and selling pollution permits based on their need to pollute. Right? So, maybe this paper company um doesn't need the permits as much as maybe a steel company, right? The steel company pollutes a lot more. And they might be willing to buy some of the permits from the paper company. So, now we create this extra market for these permits. Right? So, another way to deal with these externalities is to create a market. Another market that's gonna deal with the externality, Right? So, in this case, we've got a market for these pollution permits, and then the trading of the permits is gonna find the equilibrium price, right? Because there's only a certain amount of permits, there's only gonna be this much pollution. How much do you want to pay for a share of that pollution? Right. So that's another way that the company, excuse me, that the government can get involved and deal with externalities. Right? So they're gonna either do that command and control right? Where they're just gonna say you've got to do it this way, you're required to do this. We forbid this action, right? Or they're going to get involved in the market with these taxes, these subsidies or these tradable pollution. These permits, right? They're gonna set these kind of quantity limitations. So, any of those are ways that the government can get involved. All right, that's about it here, let's go ahead and do some practice problems before we move on to the next video. Okay, let's go ahead and do that now.
3
Problem
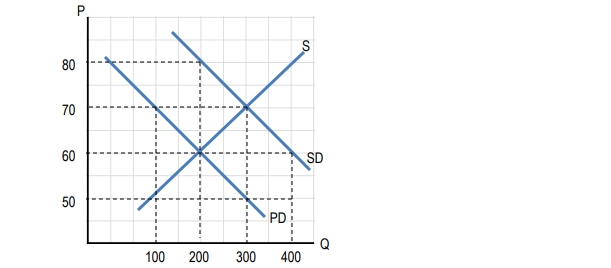
ProblemUse this diagram to answer the following questions. PD is private demand. SD is social demand.
Based on the figure above, an unregulated market would produce:
A
100 units
B
200 units
C
300 units
D
400 units
4
Problem
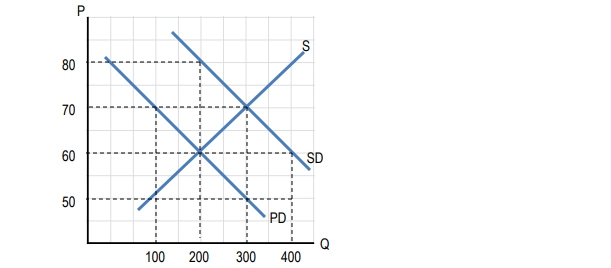
ProblemUse this diagram to answer the following questions. PD is private demand. SD is social demand.
The figure above contains:
A
A positive externality
B
A negative externality
C
Both positive and negative externalities
D
No externalities
5
Problem
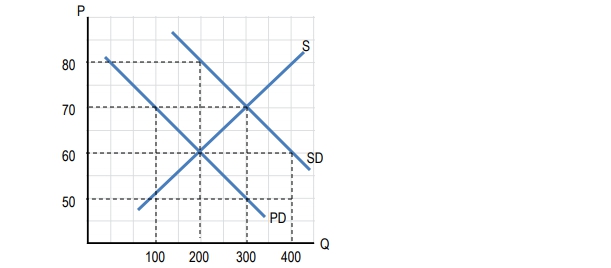
ProblemUse this diagram to answer the following questions. PD is private demand. SD is social demand.
A per-unit _______________________ would result in the production of the socially optimal quantity.
A
Tax of $10
B
Tax of $20
C
Subsidy of $10
D
Subsidy of $20