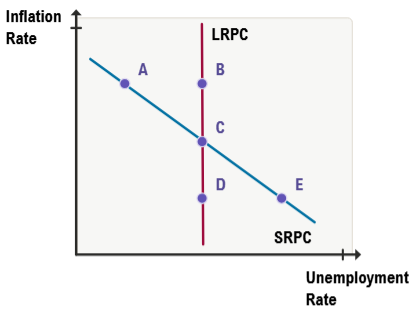
The Phillips curve illustrates the relationship between inflation and unemployment, but its short run and long run versions present seemingly conflicting views. The long run Phillips curve, typically shown as a vertical line at the natural rate of unemployment, suggests that there is no trade-off between inflation and unemployment. Regardless of whether inflation is high or low, unemployment gravitates toward its natural rate. This means that in the long run, inflation does not influence unemployment levels.
In contrast, the short run Phillips curve depicts an inverse relationship between inflation and unemployment. When inflation is higher, unemployment tends to be lower, and when inflation is lower, unemployment tends to be higher. This creates a challenge because the short run curve implies a trade-off that the long run curve denies, leading to an apparent contradiction.
To reconcile these differences, it is essential to consider the role of expected inflation. The long run Phillips curve accurately reflects the relationship between actual inflation and unemployment when expectations are met. However, in the short run, deviations between actual inflation and expected inflation can temporarily affect unemployment rates.
For example, if individuals expect inflation to be 2% but the actual inflation rate turns out to be 3%, businesses find that the real wages they pay are lower than anticipated because inflation erodes the purchasing power of nominal wages more than expected. This effectively makes labor cheaper in real terms. Additionally, since other input costs rise with inflation, labor becomes relatively less expensive compared to other inputs, incentivizing firms to hire more workers. As a result, unemployment falls below the natural rate in the short run.
Conversely, if actual inflation is lower than expected, real wages are higher than anticipated, making labor more expensive and causing firms to reduce hiring, which increases unemployment.
This dynamic explains why the short run Phillips curve slopes downward, showing an inverse relationship between inflation and unemployment, while the long run Phillips curve remains vertical. The point where actual inflation equals expected inflation is where both curves intersect, indicating equilibrium where short run deviations vanish.
Mathematically, this relationship can be expressed by incorporating expected inflation (\(\pi^e\)) into the Phillips curve equation. The short run Phillips curve can be represented as:
\[u = u^* - \alpha (\pi - \pi^e)\]where \(u\) is the unemployment rate, \(u^*\) is the natural rate of unemployment, \(\pi\) is the actual inflation rate, \(\pi^e\) is the expected inflation rate, and \(\alpha\) is a positive constant reflecting the sensitivity of unemployment to unexpected inflation.
When actual inflation exceeds expected inflation (\(\pi > \pi^e\)), unemployment falls below the natural rate (\(u < u^*\)). When actual inflation is less than expected inflation (\(\pi < \pi^e\)), unemployment rises above the natural rate (\(u > u^*\)). Over time, as expectations adjust to actual inflation, the economy moves back to the long run Phillips curve where \(u = u^*\) and \(\pi = \pi^e\).
This framework elegantly integrates the short run and long run Phillips curves by emphasizing the importance of inflation expectations in determining short run fluctuations in unemployment. It highlights that the apparent trade-off between inflation and unemployment is temporary and driven by unexpected changes in inflation rather than a permanent relationship.