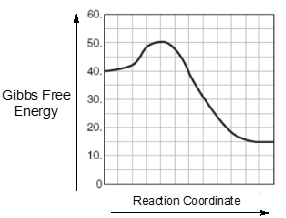
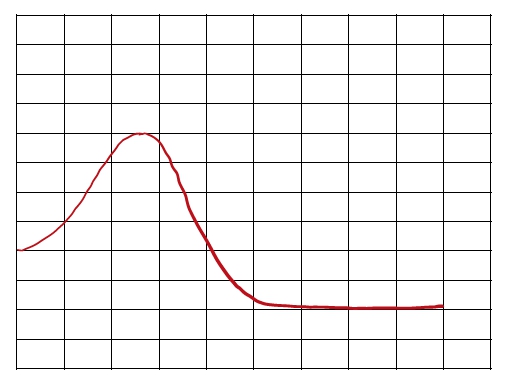
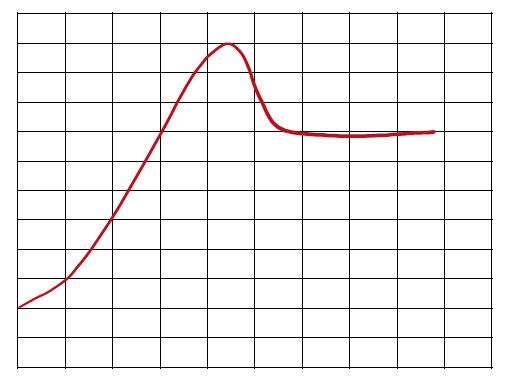
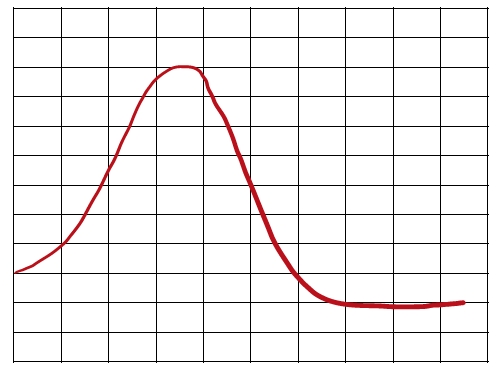
An energy diagram is a graphical representation that illustrates the energies of reactants, products, and the transition state during a chemical reaction. In this diagram, the reactants, abbreviated as r, are positioned on the left side, while the products, represented by p, are found on the right side at the end of the curve. The transition state, denoted as ts, corresponds to the maximum energy point along the reaction coordinate, which is the path from reactants to products. This transition state is also known as the activated complex.
The reaction coordinate, depicted along the x-axis, indicates the progress of the reaction, while the y-axis shows the change in energy, ranging from 80 kilojoules to 200 kilojoules. The activation energy, abbreviated as E_a, represents the minimum energy required for the reaction to proceed. It is defined as the height difference between the transition state and the energy level of the reactants. Understanding these key components—reactants, products, transition state, and activation energy—is essential for interpreting energy diagrams and grasping the energy changes that occur during chemical reactions.