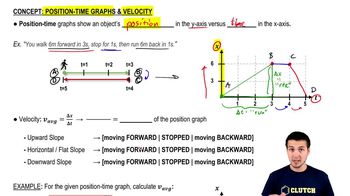
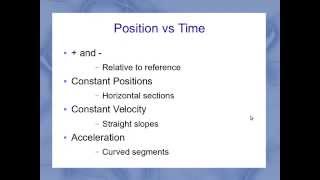
15:20Position vs. time graphs | One-dimensional motion | Physics | Khan AcademyKhan Academy Physics395views
09:14Motion Graphs (1 of 8) Position vs. Time Graph Part 1, Constant VelocityStep by Step Science718views
Multiple Choice
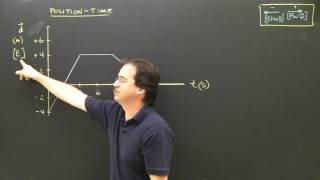
The position-time graph for a moving box is shown below.(a) What is the box's average velocity from 0 to 5s?(b) What is the box's average velocity from 0 to 8s?(c) What is the box's velocity in the interval where it's moving fastest?1779views34rank1commentsHas a video solution.
Multiple Choice
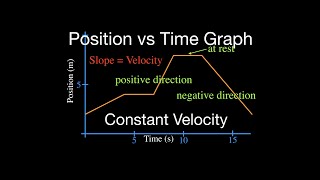
The position-time graph for a ball on a track is shown below.(a) What is the ball's velocity at 4s?(b) At what time(s) is the ball approximately travelling at -10m/s?(c) From t = 3 to 7s, what is the sign of the acceleration?1605views26rank1commentsHas a video solution.
Multiple ChoiceWhich motion diagram best represents the following event: a skier skis down a slope with constant speed?176views
Textbook QuestionA cat walks in a straight line, which we shall call the x-axis, with the positive direction to the right. As an observant physicist, you make measurements of this cat's motion and construct a graph of the feline's velocity as a function of time (Fig. E2.30). (d) Assuming that the cat started at the origin, sketch clear graphs of the cat's acceleration and position as functions of time.848viewsHas a video solution.
Textbook QuestionA cat walks in a straight line, which we shall call the x-axis, with the positive direction to the right. As an observant physicist, you make measurements of this cat's motion and construct a graph of the feline's velocity as a function of time (Fig. E2.30). (a) Find the cat's velocity at t = 4.0 s and at t = 7.0 s. 929viewsHas a video solution.
Textbook QuestionA physics professor leaves her house and walks along the sidewalk toward campus. After 5 min it starts to rain, and she returns home. Her distance from her house as a function of time is shown in Fig. E2.10. At which of the labeled points is her velocity (e) decreasing in magnitude?238viewsHas a video solution.
Textbook QuestionA physics professor leaves her house and walks along the sidewalk toward campus. After 5 min it starts to rain, and she returns home. Her distance from her house as a function of time is shown in Fig. E2.10. At which of the labeled points is her velocity (c) constant and negative? 236viewsHas a video solution.
Textbook QuestionA physics professor leaves her house and walks along the sidewalk toward campus. After 5 min it starts to rain, and she returns home. Her distance from her house as a function of time is shown in Fig. E2.10. At which of the labeled points is her velocity (b) constant and positive?505viewsHas a video solution.
Textbook QuestionA physics professor leaves her house and walks along the sidewalk toward campus. After 5 min it starts to rain, and she returns home. Her distance from her house as a function of time is shown in Fig. E2.10. At which of the labeled points is her velocity (a) zero?253viewsHas a video solution.
Textbook QuestionA block is suspended from a spring, pulled down, and released. The block's position-versus-time graph is shown in FIGURE P2.38. b. Draw a reasonable velocity-versus-time graph. 230viewsHas a video solution.
Textbook Question(II) The position of an object along a straight tunnel as a function of time is plotted in Fig. 2–40. What is its average velocity(c) between t = 0 and t = 5.0 s<IMAGE>83viewsHas a video solution.
Textbook Question(II) The position of an object along a straight tunnel as a function of time is plotted in Fig. 2–40. What is its instantaneous velocity(a) at t = 10.0 s and<IMAGE>126viewsHas a video solution.
Textbook Question(II) The position of an object along a straight tunnel as a function of time is plotted in Fig. 2–40. What is its average velocity(c) between t = 0 and t = 5.0 s<IMAGE>99viewsHas a video solution.
Textbook Question(II) In Fig. 2–40, (a) during what time intervals, if any, is the velocity constant?<IMAGE>93viewsHas a video solution.
Textbook Question(II) In Fig. 2–40, (b) At what time is the velocity greatest?<IMAGE>86viewsHas a video solution.
Textbook Question(II) In Fig. 2–40, (c) At what time, if any, is the velocity zero?<IMAGE>93viewsHas a video solution.
Textbook Question(II) In Fig. 2–40, (d) Does the object move in one direction or in both directions during the time shown?<IMAGE>95viewsHas a video solution.
Textbook QuestionFigure 2–55 shows the position vs. time graph for two bicycles, A and B.(a) Identify any instant at which the two bicycles have the same velocity.<IMAGE>118viewsHas a video solution.
Textbook QuestionFigure 2–55 shows the position vs. time graph for two bicycles, A and B.(b) Which bicycle has the larger acceleration?<IMAGE>91viewsHas a video solution.
Textbook QuestionFIGURE EX1.18 shows the motion diagram of a drag racer. The camera took one frame every 2 s. (b) Make a position-versus-time graph for the drag racer. Because you have data only at certain instants, your graph should consist of dots that are not connected together.69viewsHas a video solution.
Textbook QuestionFIGURE EX2.4 is the position-versus-time graph of a bicycle. What is the bicycle's velocity at (a) t = 5s82viewsHas a video solution.
Textbook QuestionFIGURE EX2.4 is the position-versus-time graph of a bicycle. What is the bicycle's velocity at (c) t = 30s154viewsHas a video solution.