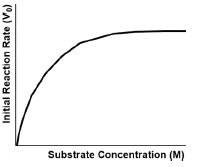
6. Enzymes and Enzyme Kinetics
Initial Velocity
1
concept
Initial Velocity
8m
Play a video:
Was this helpful?
in this video, we're going to talk a lot more about the initial velocities of enzyme catalyzed reactions. So, as we already know from our previous lesson videos, when biochemists are studying enzyme catalyzed reactions in the lab, the biochemists mainly focus on the initial rates of the enzyme catalyzed reactions. And a lot of that has to do with the fact that these enzyme catalyzed reaction rates will actually naturally decrease over time. And so the reason that these enzyme catalyzed reaction rates naturally decrease. Ah, as the reaction proceeds over time has to do with the fact that the substrate concentration is also decreasing over time. And remember that higher substrate concentration is correlated with higher reaction rate. And so ah, lower substrate concentration is correlated with lower reaction rate. And the reason that the substrate concentration is decreasing over time is because the substrate is literally being converted into products over time. Now, in addition to that, the reverse reaction from the product backwards to reform the substrate becomes mawr and mawr of a significant factor as the product concentration accumulates over time. And if this reverse reaction is becoming mawr of a factor over time, that's going to make it more difficult for a biochemist to measure the Ford reaction rate. If, uh, this reverse reaction is occurring at a significant rate. And so, essentially, as we already know, the initial velocity, which is abbreviated with the symbol the not is the reaction velocity at the very, very beginning of a reaction. And this is where the substrate concentration is at its highest. And the reverse reaction from product backwards into substrate is essentially negligible, since there's really zero or no product at the very, very, very beginning of a reaction. And so, essentially, what we're saying here is that the initial velocity, or V not is really the best chance that a reaction has at approaching its maximum velocity or the max, which we're going to talk a lot Maura about and another video a little bit later in our course. And so we'll be able to talk about this idea of approaching its maximum velocity in more detail in that video. But just to give you guys a quick preview, essentially, enzymes are not able to attain their maximum velocities there on Lee able to approach their maximum velocities, and so again, we'll talk more about that idea and a different topic when we talk about maximum reaction velocity. But for now, let's take a look at this example down below and in this example, we actually have two different graphs. We have this graph over here on the left and then we have this graph over here on the right Now looking at the graph on the left. First notice that we have the product concentration on the Y axis and the time as the reaction progresses on the X axis. And we've seen this graph plenty of times and our previous lesson videos. So we know that the curve looks just like this and ultimately we know that the product concentration stops increasing over time. And that's because the product concentration has gotten to a point where equilibrium has been reached and at equilibrium. We know that the rate of the Ford reaction is exactly equal to the rate of the reverse reaction. So we know that the reverse reaction is becoming a significant factor over time as we add enough time. However, if we look at the very, very, very beginning of the reaction, essentially where the time is really close, to zero. And we know that if we take the slope of a line that's tangent, toe, any point on this curve, we can get the reaction rate. And if we take the slope of the line that's early on in this curve, then essentially, what we could do is get the initial reaction rate because we have the initial slope. So this is the initial slope of our curve is going to give us the initial reaction rate, and the reaction rate is always gonna be the change in product concentration over the change in time. So essentially you can see we have product concentration and change in time. And so, looking at this graph over here on the right notice, the instructions are telling us to draw in the curve for the second graph below. So there is no curve, and we need to draw it the curve in and in this curve notice that, uh, the Y axis is actually changing. So it's very, very important for us to note what the's Y axes actually are. So in this Y X is what we have is the reaction rate. And on this one we have the product concentration. And so over time, as we already discussed above, we know that over time reaction rates will naturally decrease over time. And so what we expect is that the reaction rate here is actually going to decrease over time, so it's going to start really high. But then ultimately it's going to decrease as time progresses. And so essentially, this is what we expect the curve toe look like. Now, we haven't really seen curves that look like this just yet in our previous videos on. So maybe you guys were tempted to draw curve that looked like this very similar to the one that was over here. However, we need toe again, pay really close attention to the Y axis and the X axes as well. And so what we can see here is that it's reminding us that as time passes, the reaction rate of an enzyme catalyzed reaction will actually decrease as we see over here as time progresses, notice that the reaction rate is actually going down. And so what this means is that the initial reaction rate for V not is gonna be the fastest possible rate. And so the initial, uh, reaction rate comes where we have the initial time, and the initial time is where the time is approximately equal to zero really, really early on. And so here we can expect to find our initial reaction rate really, really early on in the reaction. And so this is our V not. And so that's why we expect the initial reaction rate to be the fastest rate now. What's really important to note is that all of the enzyme kinetics calculations that we're going to see in our course moving forward in this point are going to assume that the reaction velocity that's measured is the initial velocity or V not, and so essentially because the initial velocity allows us to approach the maximum velocity. Uh, that means that it makes it easier to essentially compare reaction velocities of different enzyme catalyzed reactions when we're specifically focusing on the initial velocity. If we weren't comparing the initial velocities, then essentially it would be very, very difficult to compare reaction velocities across, uh, different enzyme catalyzed reactions. And so essentially, this concludes our lesson on initial reaction velocity, and we'll be able to apply all of these concepts that we've learned here as we move along in our course, and so I'll see you guys in our next lesson video, where we'll be able to talk about the enzyme kinetics plots.
2
concept
Initial Velocity
9m
Play a video:
Was this helpful?
alright. So from our previous lesson video, we know that biochemist mainly focus on the initial reaction velocities of enzyme catalyzed reactions. And so in this video, we're going to talk about a plot that biochemist used commonly to measure those initial reaction velocities. And this is known as an enzyme kinetics plot. And so an enzyme kinetics plot graphs the initial reaction velocity of an enzyme catalyzed reaction, or V not on the Y axis of the plot, and it plots the substrate concentration on the X axis of the plot. And so if we take a look at our image down below on the left hand side, we have an enzyme kinetics plot. And so notice we have the initial reaction velocity on the Y axis, and we have the initial substrate concentration on the X axis and notice here, looking at all of these data points right here, if we follow it and make a curve, it makes a curve that looks really similar to the previous curves that we saw in our previous lesson. Video. However, what we need to take into account is what's actually on the X axis. As simple as that might sound, And so what you'll notice is on the X axis. What we have is the initial substrate concentration. Whereas in our previous graph, where we saw this similar curve notice we don't have the substrate concentration. We have this curve here, but we don't have substrate concentration. Here we have the time and seconds on the X axis. So that means that we're monitoring the progress of the reaction over time. Whereas we're not doing the same thing down below. We're not monitoring the progress of the reaction over time. We're monitoring actually different reactions, uh, that have different substrate concentrations. And so what's really, really important to note that our lesson is trying to tell us here, is that the initial reaction velocity or V not can Onley occur at one very specific period of time really, really early on at the very, very beginning of the reaction. So what this means is that we actually cannot monitor the initial reaction velocity over time because over time it won't be the initial reaction velocity anymore. It'll just be reaction velocity, but not initial. And so what this means is that on an enzyme kinetics plot, whenever we're including the initial reaction velocity. There's no way that time can be on the X axis, and so that's why we have. This cannot equal to each other for, um, this part right here. And so instead of looking at this graph as a solid line noticed down below, we have these data points instead. And so even though in your textbook it's likely going to show this same graph right here, or a similar graph, and it's going to show a solid line like this sometimes it's better to think of this graph as individual data points. And so the reason for that is because, really, these data points come from completely separate experiments. So you can imagine that there's one experiment in one test tube in a lab, and the biochemist chooses one initial substrate concentration. That's really, really low. And, uh, then they measure the enzyme catalyzed the initial reaction of the enzyme catalyzed reaction at that substrate concentration, and they plot that data point here and then in a different test tube. What they do is they take the initial substrate concentration and they increase it just a little bit, and then they measure the initial reaction rate of the reaction in that test tube, and then they plot that data point here. And so they can continue to do that. And they can get lots and lots of data points. And ultimately, if we do a curve of best fit for all of these data points, that's what you see in your textbooks. But, uh, if you draw a line like this, it's important to note that we're not really monitoring the, uh, initial reaction rate over time. Because, remember, time is not on the X axis. Instead, we're looking at the substrate concentration on the X axis, so that's really, really important to note. And that's really what makes this graph so much different from the graph of above. Also noticed that the Y axis is completely different. So on the Y axis in this graph, we have the product concentration, whereas the Y axis on this graph, we have the initial reaction rate, and so what this means is because the axes are different and the graph shown here and the graph up above from our previous lesson video up here because the axes are so different from one another. Essentially, what this means is that when this graph here actually levels out at this point, it's actually meaning something completely different than when the graph levels out up above. And so when the graph levels out up above, we said that it's because the product has reached equilibrium and that's why the product concentration is no longer changing over time. However, when the graph levels out in this graph this enzyme kinetics plot below, it means something different. It doesn't mean that equilibrium is reached because remember, this is at the very, very beginning of the reaction, and it takes time for the reaction to reach equilibrium. Instead, the graph is leveling out here because the enzyme has become saturated with substrate. And so that is a completely different interpretation off this graph. As you can see, this leveling out corresponds with enzyme saturation. We have such high concentration of substrate in our test tube that it does not increase the initial reaction rate any further, and so that's really, really important to note. Now, over here, what I also want to point out is that we have a graph where we're comparing the same. Uh, we're comparing two different axes here. We have the initial reaction rate just like we had it over here. Uh, the initial reaction rate. But then we also have the reaction rate. Uh, not the initial reaction rate, but the reaction rate after 30 seconds. Just like what we saw up above here, we saw that we had the initial reaction rate, which was at the time, uh, where the time was close to zero. And then we had the reaction rate after 30 seconds. And so if we take a look at the reaction after 30 seconds, the data, which is in green notice that the reaction after 30 seconds actually has ah smaller reaction rate than the initial reaction rate at the same corresponding, uh, substrate concentrations, initial substrate concentrations. And so notice that if we were to choose this particular substrate concentration right here, notice that the reaction rate after 30 seconds is gonna be much smaller than the initial reaction rate. Uh, for the same substrate concentration. And so that's really important to note how why biochemists like to focus on the initial reaction velocities instead of the reaction velocities at different periods of time, such as 30 seconds end, because it makes it appear that the maximum velocity is actually something different, then what it actually could be. And so essentially, what's really also important to note is that the initial reaction velocity will actually vary with substrate concentration when all of the other variables that influence the reaction rate, such as temperature, pH and even enzyme concentration are all constant. So that's something that's really important to note that because these are all separate experiments that are being conducted that we need to ensure that between all of these separate experiments that all of the other variables are going to remain constant. Otherwise, we wouldn't be able to compare these data points with one another. And so essentially, this concludes our lesson on enzyme kinetics plots. And one of the main takeaways from this video is that you really want to focus on the axes, and the axes of the plot here are going to really dictate the interpretation that you should have, such as this horizontal, uh, portion of the graph corresponding with saturated substrate concentration rather than corresponding with equilibrium being reached. And so that concludes our lesson on enzyme kinetics plots, and we'll be able to get some practice throughout our course as we visit. Revisit this plot multiple times and in our practice video, so I'll see you guys there.
3
Problem
ProblemWhy is the initial velocity (V0) the best chance a reaction has at approaching its maximum velocity (Vmax)?
A
[Substrate] decreases over time.
B
Reverse reaction from Reactant ← Product becomes more significant over time.
C
Reaction rates increase over time.
D
a and b.
E
All the above.
4
Problem
ProblemCalculate the initial reaction rate for A → B, given that [A] i = 9.6 M, [B] i = 0 & [A] f after 0.01 μsec = 9.14 mM.
A
46 M/s.
B
959 M/s.
C
9.59 x 10⁸ M/s.
D
4.6 x 10⁷ M/s.
5
Problem
ProblemIn the graph below, why does the curve have a steep incline at first that gradually declines to a horizontal line?
A
Because the substrate becomes an inhibitor at high concentrations.
B
Because the substrate is able to stimulate the enzyme at low concentration.
C
Because the transition state complex is more unstable at low substrate concentrations.
D
Because the available enzyme is saturated with substrate at high enough concentrations.
E
Because the Gibbs free energy approaches zero at high substrate concentrations.