Pearson+ LogoPearson+ Logo
Start typing, then use the up and down arrows to select an option from the list.

Biochemistry

Learn the toughest concepts covered in Biochemistry with step-by-step video tutorials and practice problems by world-class tutors

6. Enzymes and Enzyme Kinetics

Lineweaver-Burk Plot

1

concept

Lineweaver-Burk Plot

clock
6m
Play a video:
Was this helpful?
in this video, we're going to begin our discussions online. Weaver Burke plots by first introducing the line Weaver Burke equation. So recall from our previous lesson videos that the meticulous Meant in Equation describes the rectangular hyperbole that we see in a meticulous Benton enzyme kinetics plot. And so the line Weaver Burke equation also describes enzyme kinetic data that we see forming a line in a line Weaver Burke plot. And so the good thing about the line Weaver Burke equation is that really it's nothing new. We can pretty much say that the line Weaver Burke equation is the reciprocal of the meticulous meant in equation. So really, we can take the McHale is meant in equation and simply invert the equation or take the reciprocal of it and then do a little bit of algebraic rearrangement to obtain the line Weaver Burke equation, which is shown right over here. So notice that the line Weaver Burke equation has the same exact enzyme kinetics variables as the meticulous meant an equation that we already covered. So they both have the initial reaction velocity, the K M, the V max and the substrate concentration. And so if we take a look down below at our image. Noticed that on the left. Here we have the McHale is mentioned equation that were already familiar with from our previous lesson videos. And so if we want to obtain the line Weaver Burke equation without having to commit it to memory, all we need to do is take the reciprocal of the Michaelis Menton equation. And the reciprocal just means to essentially invert the equation. Now, if we invert one side of the equation, we also have to invert the other side of the equation. And so let's go ahead and start with this left side over here. So if we take the reciprocal of the initial reaction velocity, that's going to be inverting it. So what we're gonna be left with on the left hand side is one over the initial reaction velocity. So now that we've taken the reciprocal of the left hand side, we can take the reciprocal of the right hand side over here. And so taking the reciprocal of the right hand side is essentially just going to be taking the denominator or what's on bottom and placing it on top, and it's gonna be taking the numerator or what's on top and placing it on the bottom. And so that's exactly what we're gonna do when we take the reciprocal here. So now we're gonna take the bottom, which is K m plus substrate concentration, and put that on the top. So we're gonna have K m plus substrate concentration on the top. And then, of course, on the bottom down here, what we're gonna have is what used to be on the top. So that's going to be the V Max time substrate concentration. So that is essentially the reciprocal of the Mackiewicz meant an equation. Now all we need to do is to steps of algebraic rearrangement. So recall that when we have addition going on in the numerator that we can actually separate out these two components. We can separate the K M from the substrate concentration as long as they both have their own common denominator here. And so that's exactly what we're going to do down below in the next stage right here. And so notice that the left hand side of the equation stays exactly the same. It's still the reciprocal of the initial reaction velocity, so we haven't done anything to that. But what we're essentially going to do is separate the K M and the substrate concentration so that they each have their own denominator. And so that's exactly what we see down below. Notice that the K M is now separated from the substrate concentration. Uh, the addition is still here, but they they both have their own set of the same common denominator. And so that's exactly what we've done. And so notice that with this expression over here, these substrate concentrations actually cancel each other out. So this expression right here simplifies to just one over v max and then notice that this expression over here we can actually take the K M and the V Max right here and separate it from one over substrate concentration. And that's exactly what we see down below. We have the came over the V Max Times one over substrate concentration and really, that is it that allows us to get the line. Weaver Burke equation, which I'll admit at first glance, looks pretty complicated, but we were able to obtain it just by taking the reciprocal of the Mikhail's mental equation that were already familiar with and doing two steps of algebraic rearrangement. Now again, this line Weaver Burke equation appears to be pretty complicated. But trust me, it's definitely not as complicated as it looks. And that's because it's no surprise that the line Weaver Burke equation actually resembles the equation of a line. And, of course, we all know that the equation of a line is why equals M X plus B. So notice Over here. On the right hand side, we have the equation of a line, which is again, Why equals M X plus B? And so, just like we can substitute in enzyme kinetics variables into a rectangular, hyper below equation to get the Makayla cement in equation from our previous awesome videos, we can also substitute in enzyme kinetics variables into the equation of a line to get the line Weaver Burke equation. And so notice that the why in our equation here is just going to be substituted with exactly what is on the Y axis of a line weaver bird plot, which is the reciprocal of the initial reaction velocity. Now we know that the M is just going to be the slope of the line, and so in the line. Weaver Burke equation. The slope is equivalent to the ratio of the K M over the V Max. Now the X is going to be exactly what we find on the X axis of our line with Herbert plot, which is going to be the reciprocal of the substrate concentration. And then, of course, the be here is going to be the Y intercept of our line and the B or the Y intercept in the line. Weaver Burke plot is just gonna be one over v Max. And so you can see here how the line Weaver Burke equation really does resemble the equation of a line. And that's why the line Weaver Burke equation describes the line that forms on a line. Weaver Burke plot and we'll talk about line. Weaver Burke plots in our next lesson video, so I'll see you guys there
2

concept

Lineweaver-Burk Plot

clock
8m
Play a video:
Was this helpful?
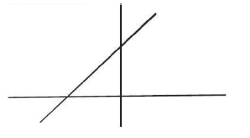
So now that we've introduced the line Weaver Burke equation in our last lesson video in this video, we're going to introduce the line Weaver Burke plot, which is really just another way toe plot enzyme, kinetics data and so recall from our previous lesson videos, we had an enzyme kinetics plot and many of our videos and in the enzyme kinetics plot, we had the initial reaction velocity on the Y axis and the substrate concentration on the X axis. And we know that McHale is meant in enzymes will form this rectangular hyperbole a shape on this curve, which is definitely mawr, complicated of a shape than a straight line. And so, instead of getting a rectangular hyperbole shape the line Weaver Burke plot, of course, is going to get a line. And so that's somewhat of an advantage of line Weaver Burke plots that were able to interpret the data just using a very simple, straightforward line. And from this straight line that we get on a line with Robert Platt were able to obtain the values the values for both the theoretical Maximum Velocity V Max as well as the Michaelis constant K M and again these air, both able to be determined from the straight line of a line Weaver Burke plot. Now it's also important to note that sometimes line Weaver Burke plots are also referred to as double reciprocal plots. And the reason that they're referred to as double reciprocal plots is because noticed that on the plot there's going to be a bunch of reciprocal and so notice that instead of having the initial reaction velocity on the Y axis on a line Weaver Burke plot notice that on the Y Axis what we have is the reciprocal of the initial reaction velocity. And so that's what we're saying here is that we plot the reciprocal of both the initial reaction velocity as one over V. Not here, but we also plot the reciprocal of the substrate concentration. So instead of plotting the substrate concentration ah, line we have Robert plot plots, the reciprocal off the substrate concentration or one over the substrate concentration on the X axis. And so when uh, scientists do this when they plot these double reciprocal, they're able toe turn their data into ah, linear format. And so what's important to note as we kind of already mentioned in our last lesson video. Is that the slope of the line that forms? So notice here, Uh, the line that we get here, The slope of this line in a line Weaver Burke plot is going to be the ratio of the Mikhail is constant k m over the V max. So essentially k m over V max will be equal to the slope of the line. And so notice over here on the left. What we have is the line Weaver Burke equation that we introduced in our last lesson video. And we know that it resembles the equation of a line. So we know that this reciprocal here is going to be the why of our line. And we know that it's found on the Y axis for that reason. And so we know that the equation of the line is y equals mx plus B. So the m here. As we said above, we know the M is going to be our slope and the slope of the line in a line. Weaver Burke plot is just going to be the ratio of the K M over the V max. So this here, eyes going to be the M, which means that the X so the M X is going to be the reciprocal of the substrate concentration. And that's what goes on the X axis of our plot. So, uh, that's what goes down here, one over substrate concentration. And then it's gonna be plus B, and we know that the B is going to be the Y intercept, which is pretty much where our line crosses the y axis. So where are line crosses? The Y axis is right at this point, and that's why it's called the Y intercept or be. And so the Y intercept is just gonna be the reciprocal of the V max or one over V Max. And so here, what we can see is that the Y intercept here is going to be be. And that's gonna be one over V max. So we can write that in here. One over. V Max, The X intercept recall is just where our line crosses our x axis. So where these two points me is gonna be right here, and so this is going to be our X intercept. And the X intercept is also going to be the reciprocal. It's going to be the reciprocal of the K M. However, and it's gonna actually be the negative. Reciprocal. So it actually has a negative sign, negative one over K M, whereas none of our other reciprocal is have a negative sign. And the reason that it has a negative sign is because notice that our X intercept here is falling into the negative region of our plot. So here, zero, here are the positive numbers and then to the left of the negative numbers. And so because the X intercept falls into the negative region, that's why, uh, it has a negative here. And so, of course, we already said that the slope of this line here is going to be M. And we said that it's going to be the ratio of the K M over the V Max so we could indicate that here is well, k m over v Max. And so, really, these are the most important components that we need to take note of when it comes to a line. Weaver Burke plot. Now, one additional thing that I want you guys to notice is that, uh, notice that over here on this part of our line that it is a solid line. But over here, what we have is a dotted line. And so the reason for that is because notice that, uh the, uh in order to get into this region over here, where this dotted line is, we're actually gonna need tohave negative negative substrate concentrations to get over here. And, uh, in reality, we're not able to get negative substrate concentrations. The lowest substrate concentration that we can get is zero. And so, uh, this here, we're never gonna actually have data that falls into this region of our graph. So it's never gonna fall into that region. Our data that we collect from an experiment is always gonna fall over here, Which is why we have this solid line here and again that has to do with We can only have positive substrate concentrations, and so the data will fall over here. But we can always draw an imaginary line. So that's what this really is. An, um, imaginary line that extends. And where this imaginary line crosses the X axis, that's going to be the X intercept here, where we can derive the K M from and so you can see, as we mentioned up above that from this straight line here were able to derive both the values for the V Max and the K M. And there's different ways that we could do that. We can do it through the slope because it has the K m over the V Max. We could do it through the Y intercept, which has just the reciprocal of the V Max, and we can do it through the X intercept. And so, just by being familiar with the equation of a line the line Weaver Burke plot, um, the line Weaver Burke equation. I'm sorry. And the line Weaver Burke plot were able to solve a lot of problems that, uh, teachers like to ask on your biochemistry exams. So moving forward, we're gonna talk even mawr. About line. Weaver Burke plots to break them down even further. Um, but this is a good initial introduction to line Weaver Burke plots. And in our next lesson video, we're gonna focus more specifically on these intercepts the Y intercept as well as the X intercept. So I will see you guys in that video
3

concept

Lineweaver-Burk Plot

clock
4m
Play a video:
Was this helpful?
all right. So now that we've introduced both the line Weaver, Burke equation and the line Weaver Burke plot in this lesson video, we're going to focus specifically on the why in the X intercepts of a line on a line Weaver Burke plot. Now the reason that we want to focus so much attention on the why and the Ex intercepts is because the most important information on a line we were Burke plot is actually revealed through these intercepts of the line. And that's because the why intercept in the X intercept are capable of revealing the V Max and the K M of an enzyme. But hang on. Not so fast, because the intercepts do not directly reveal the V Max in the K M instead. Since ah line Weaver Burke plot is also known as a double reciprocal plot. Pretty much everything is the reciprocal, including the intercepts. And so this means that the why intercept is going to reveal the reciprocal of the V Max. Essentially, the Y intercept is going to be one over the V max. And so if we want to get the V max from the Y intercept, then we need to take the reciprocal of the Y intercept now. Similarly, the X intercept is also going to be the reciprocal. Instead, the reciprocal is going to be of the K M and not of the V Max. Now we also need to recall from our previous lesson video that the X intercept on a line with Herbert plot will always fall into the negative region of the X axis. Which means that the X intercept is always gonna have a negative value and that it's always going to be the negative reciprocal of the K M. Which is why we have negative one over the K M. Now. Also recall from your previous math courses and chemistry courses and things like that that the why intercept is going to be where the line intercepts or crosses the Why access and that can Onley happen when the value of X is equal to zero. And, of course, the X intercept is going to be exactly where the line intercepts or crosses the X axis. And that can only happen when the value of why is equal to zero. And so if we take a look up at our line, we have Robert plot from our previous lesson. Videos recall that the Y axis is going to be the vertical axis here, and the X axis is going to be the horizontal axis. Now, the why intercept shown here is going to be exactly where our line crosses the why axis the vertical y axis, which is right at this point right here. Now, one way that helps me distinguish between the why and the ex intercepts. And what they reveal is that I know that on an enzyme kinetics plot, whether it be, um, Achilles meant an enzyme kinetics plot or a line with Herbert plot. This y axis I know is always associated with a reaction velocity. And so it's no surprise that the why intercept, which is associated with y Axis, is also related to a reaction velocity. More specifically, the maximum reaction velocity. And we know already that the Y intercept is going to be a reciprocal on a line with Robert plots. Since we know line with Robert, plots are also known as double reciprocal plots, and pretty much everything is the reciprocal, including thes intercepts. Now for similar reasoning, I know that the X intercept is always going to be associated with the X axis, which is where our line crosses the X axis, which is right at this position on this plot. And I know that because the X intercept is always associated with the X axis and the X axis, whether it be, um, Achilles meant in plot or a line with Herbert plot, it's always associated with a substrate concentration. And so I know that the X intercept, for that reason has to be associated with a substrate concentration, not of reaction velocity. And so recall that the K M is a substrate concentration, not a reaction velocity. And, of course, again, the X intercept we know is gonna be a reciprocal because line we've Robert plots are double reciprocal plots. So it's the reciprocal of the K M. And again recall that the X intercept always will fall into the negative region when it's a line Weaver Burke plot. And that means that the X intercept is actually going to be the negative reciprocal of the K M. And so moving forward will be able to get a lot more practice focusing on these Y and X intercepts in the information that they reveal. So that concludes this lesson, and I'll see you guys in our next video
4
Problem

To determine the Vmax from a Lineweaver-Burk plot you would:

5
Problem

A Lineweaver-Burk plot generates a line with the following formula: y = 0.3x + 0.4. What is the Km?

6
Problem

Consider the equation for the line on the following Lineweaver-Burk plot: y = 6x + 3

A) What is the Km for the corresponding enzyme?

a) -2 mM 

b) 18 mM 

c) 2 mM 

d) 9 mM

B) What is the Vmax for the corresponding enzyme?

a) 0.333 mM/s 

b) 9 mM/s 

c) -6 mM/s 

d) 18 mM/s

7
Problem

Suppose the data on the right is plotted onto a Lineweaver-Burk plot to obtain a straight line.


A) What is the value of the y-intercept of the line? ____________

B) What is the value of the x-intercept of the line? ____________

Was this helpful?
Divider