Understanding protein-ligand interactions is crucial in biochemistry, particularly when discussing fractional saturation, which can be represented by the Greek letter θ (theta) or the capital letter Y. While both symbols denote the same concept, this summary will primarily use θ for clarity. Fractional saturation refers to the fraction of ligand binding sites on a protein that are occupied by ligands, essentially indicating how saturated a protein sample is with ligands.
The formula for fractional saturation is expressed as:
θ = \(\frac{[P \cdot L]}{[P \cdot L] + [P]}\)
In this equation, [P · L] represents the concentration of the protein-ligand complex, while [P] denotes the concentration of free protein. This ratio provides insight into the binding dynamics of the protein and the ligand.
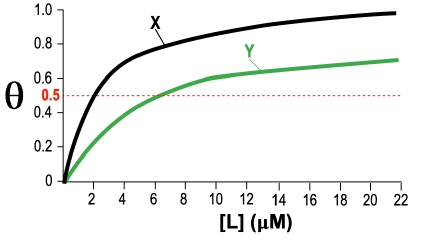
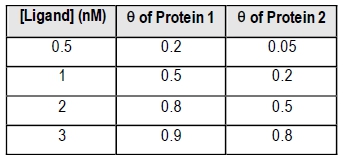
Fractional saturation values range from 0 to 1, where 0 indicates no ligand is bound, and 1 signifies that all binding sites are occupied. A critical point to note is the dissociation equilibrium constant, Kd, which is expressed in molarity. The Kd value corresponds to the ligand concentration at which 50% of the binding sites are occupied, equating to a fractional saturation of θ = 0.5.
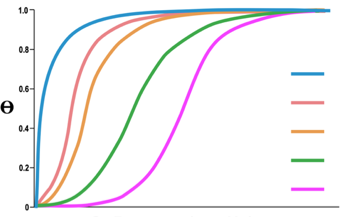
The relationship between ligand concentration and fractional saturation can be visualized in a saturation curve, which plots θ on the y-axis against ligand concentration on the x-axis. This curve typically resembles a rectangular hyperbola, similar to the Michaelis-Menten equation, illustrating how binding affinity changes with varying ligand concentrations.
In summary, fractional saturation is a key concept in understanding how proteins interact with ligands, providing valuable insights into binding affinities and the dynamics of protein-ligand complexes.