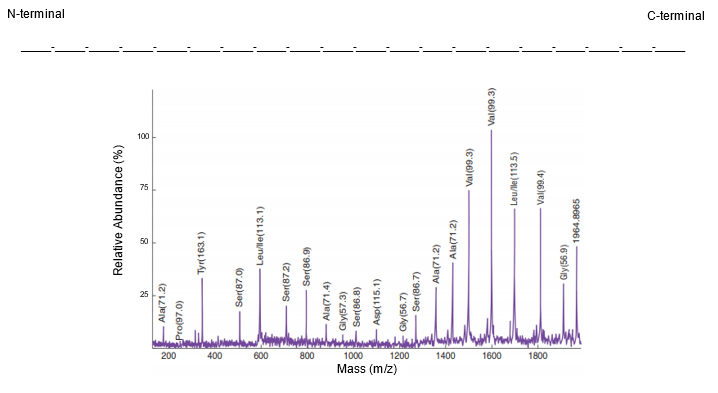
A mass spectrum is a graphical representation of mass spectrometry data, plotting relative abundance on the y-axis and the mass-to-charge (m/z) ratio on the x-axis. Each peak in the mass spectrum corresponds to different peptide fragments resulting from the cleavage of an original peptide at specific peptide bonds. Understanding how to analyze a mass spectrum is crucial for revealing the primary structure of proteins, which includes the amino acid composition and sequence from the N-terminal to the C-terminal end.
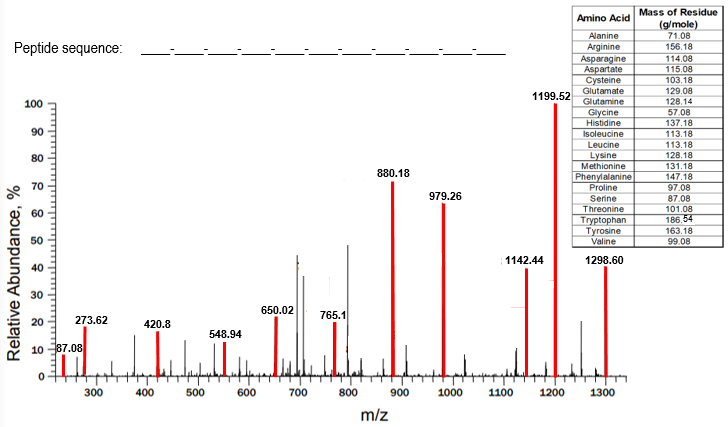
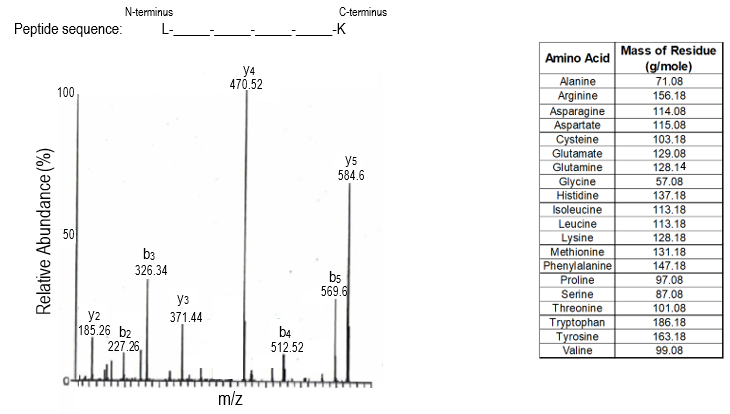
In a mass spectrum, the largest peaks represent unfragmented peptides, which have the highest m/z ratios and appear furthest to the right. For example, if a pentapeptide (a peptide with five amino acids) does not fragment, it will show a peak corresponding to its total mass. If a peptide bond is cleaved, the resulting fragment will have a lower mass, and the difference in mass between the peaks can be used to identify the amino acid that was removed. This is done by calculating the mass difference (Δmass) and comparing it to known molecular weights of amino acids.
For instance, if the mass difference between two peaks is 99.08 g/mol, it corresponds to the amino acid valine. Similarly, if the difference is 137.18 g/mol, it indicates asparagine. This process continues for each peptide bond cleaved, allowing for the identification of all amino acids in the sequence. The analysis typically proceeds from the right to the left of the spectrum, revealing the sequence from the N-terminal to the C-terminal end.
However, mass spectrometry has limitations, such as the inability to distinguish between leucine and isoleucine, which are isomers with identical masses. This characteristic poses a challenge in accurately identifying these amino acids based solely on mass spectrometry data.
In summary, mass spectrometry is a powerful tool for determining the primary structure of proteins by analyzing mass spectra, identifying amino acids through mass differences, and understanding the fragmentation patterns of peptides.