Significant Figures describe the precision of a measured value: the more significant figures a measurement has, the more precise it is. In Significant Figures: Precision in Measurements, precision is tied to how much detail a number reports, especially when comparing values written with and without a decimal point. A measurement such as 25.00 is more precise than 25 because it communicates more recorded detail.
When recording a measurement, include all known numbers from the scale and one additional estimated digit. This extra place reflects the unavoidable uncertainty in reading tools such as a ruler, beaker, or burette. That final estimated digit is found using the eyeball test, a best guess based on where the reading falls between marked lines. In practice, the correct reported value must show the proper number of decimal place digits so the measurement reflects the instrument’s precision.
Significant Figures are used to discuss the level of precision in any measurement.
Recording Measurements
0
Concept
Significant Figures Precision Concept
Video duration:
1m
Play a video:
Significant Figures Precision Concept Video Summary
Significant figures are crucial in data analysis and affect the precision of our answers. The concept of significant figures indicates that the more significant figures a measurement has, the more precise it is. For instance, a measurement of 25.00 mL is more precise than 25 mL because the former includes a decimal point, indicating a higher level of detail. In the case of 25.00 mL, the first non-zero digit is 2, and counting all the way to the end gives us four significant figures. Conversely, 25 mL, which lacks a decimal point, has only two significant figures.
When recording measurements, it is essential to consider significant figures. The rule is to include all known digits plus one additional estimated digit. This practice is often referred to as the "eyeball test," which involves making an educated guess based on visual observation of measuring tools like beakers or measuring tapes. It is important to recognize that there is inherent uncertainty in these measurements, and simply relying on the visible markings is insufficient. Therefore, adding an extra decimal place helps ensure the correct number of significant figures is recorded, enhancing the accuracy of the measurement.
Study Smarter with Worksheets.
Follow along with each video using our printable worksheets
0
Example
Significant Figures Precision Example
Video duration:
33s
Play a video:
Significant Figures Precision Example Video Summary
When determining the number of significant figures in a measurement, it is essential to understand how to accurately represent the precision of that measurement. In this example, the length of a square is measured at 3.2 centimeters, with hash marks indicating the values of 3.0, 3.1, and 3.2 centimeters. To express this measurement with the correct number of significant figures, one must consider the precision of the measurement tool used.
In this case, since the measurement is taken between the 3.2 and 3.3 centimeter marks, it is appropriate to include an additional decimal place to reflect the precision. Therefore, the measurement should be recorded as 3.20 centimeters. This notation indicates that the measurement is precise to the hundredths place, thus ensuring that the significant figures are accurately represented. Consequently, the best answer is 3.20 centimeters, which corresponds to option C.
0
Problem
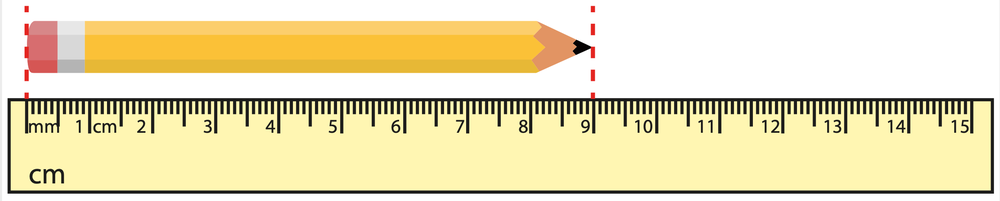
Read the length of the pencil to the correct number of significant figures.
A
8.0 cm
B
8.000 cm
C
9 cm
D
9.0 cm
E
9.00 cm
0 Comments for
0
Problem
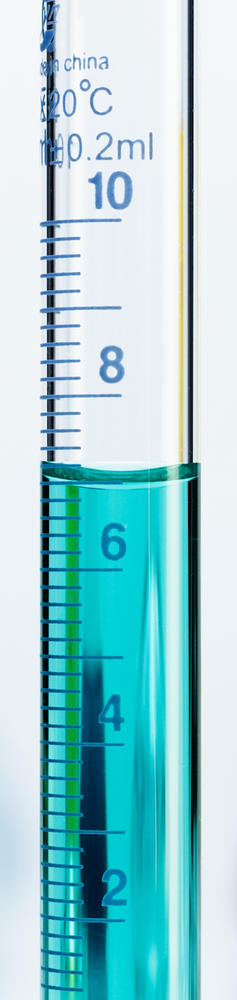
What is the correct reading for the liquid in the burette provided below?
Significant figures are the digits in a measurement that carry meaningful information about its precision. They include all known digits plus one estimated digit, reflecting the uncertainty in the measurement. The importance of significant figures lies in their ability to communicate how precise a measurement is. For example, a measurement of 25.00 mL has four significant figures, indicating a higher precision than 25 mL, which has only two. Using significant figures correctly ensures that calculations and reported results reflect the true level of certainty, preventing overstatement of accuracy. This is crucial in scientific work where precise data interpretation affects conclusions and reproducibility.
To count significant figures, start by identifying the first nonzero digit from the left. All digits from this point to the end of the number are significant. If the number contains a decimal point, count all digits from the first nonzero digit to the right, including zeros. For example, 25.00 has four significant figures because the decimal point indicates that trailing zeros are significant. In contrast, 25 without a decimal point has only two significant figures, as trailing zeros without a decimal are not counted. This method helps determine the precision of the measurement and ensures proper reporting.
Including an estimated digit when recording measurements accounts for the inherent uncertainty in reading instruments. Measurement tools like rulers or beakers have limited resolution, so the last digit recorded is an estimate between the smallest marked divisions. This estimated digit reflects the best guess of the observer, known as the "eyeball test." It ensures that the measurement includes all known digits plus one uncertain digit, providing a realistic level of precision. Without this estimated digit, the measurement would falsely imply greater accuracy than the instrument can provide, leading to misleading results.
The number of significant figures in a measurement directly indicates its precision. More significant figures mean the measurement is more precise because it provides more detailed information about the value. For example, 25.00 mL (four significant figures) is more precise than 25 mL (two significant figures) because it shows the measurement was taken with finer resolution and includes an estimated digit. Precision reflects how carefully a measurement is made and reported, not just the instrument's capability. Proper use of significant figures ensures that the reported data accurately represents the measurement's reliability.
The "eyeball test" refers to the process of estimating the last digit in a measurement by visually assessing the position between marked divisions on a measuring instrument. Since instruments like rulers or beakers have limited scale markings, the observer must make a best guess for the digit beyond the smallest marked unit. This estimated digit is included as the last significant figure to reflect the uncertainty inherent in the measurement. The eyeball test is essential for ensuring that measurements are recorded with the correct number of significant figures, accurately representing the precision and uncertainty of the data.