Join thousands of students who trust us to help them ace their exams!
Multiple Choice
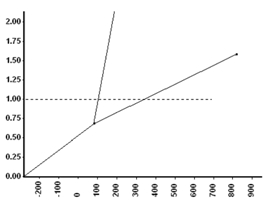
At what temperature can we no longer tell the difference between the liquid and gas phases?
A
100 °C
B
200 °C
C
400 °C
D
800 °C
E
820 °C
1 Comment
Verified step by step guidance
1
Identify the concept of the critical point, which is the temperature and pressure at which the properties of the liquid and gas phases become indistinguishable.
Examine the graph provided. The graph likely represents a phase diagram, showing the relationship between temperature and pressure for a substance.
Locate the critical point on the graph. This is typically where the liquid and gas phases converge, and the line representing the phase boundary ends.
Observe the temperature axis on the graph. The critical temperature is the point where the phase boundary line ends, indicating the temperature at which the liquid and gas phases are indistinguishable.
Compare the observed critical temperature from the graph with the given options (100 °C, 200 °C, 400 °C, 800 °C) to determine the correct answer.


 Verified step by step guidance
