15. Chemical Kinetics
Arrhenius Equation
Problem 66
Textbook Question
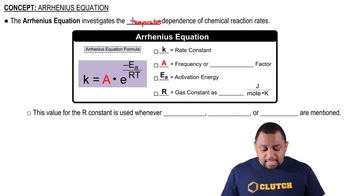
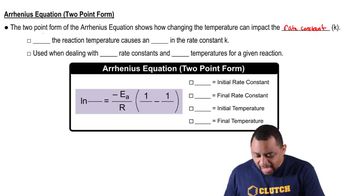
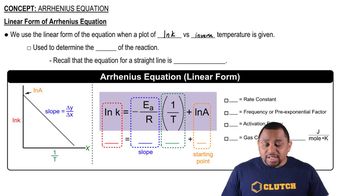
Textbook QuestionThe tabulated data show the rate constant of a reaction measured at several different temperatures. Use an Arrhenius plot to determine the activation barrier and frequency factor for the reaction. Temperature (K) Rate Constant (1 , s) 300 0.0134 310 0.0407 320 0.114 330 0.303 340 0.757
 Verified Solution
This video solution was recommended by our tutors as helpful for the problem above
Video duration:
4mPlay a video:
2332
views
Was this helpful?
Related Videos
Related Practice
Showing 1 of 10 videos


