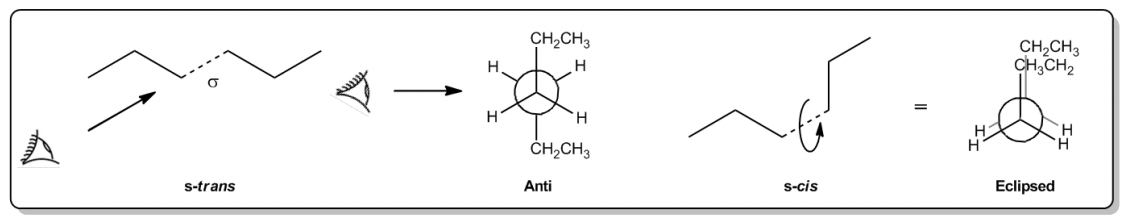
Understanding sigma bonds and their ability to rotate is crucial in visualizing molecular conformations, particularly through a technique known as the Newman projection. This method allows chemists to analyze the energy levels associated with different conformers that arise from the rotation of a sigma bond. In the context of alkanes, such as hexane, Newman projections help differentiate between various conformations, like S-trans and S-cis, by providing a clearer picture of their spatial arrangements.
When visualizing a Newman projection, imagine looking directly down the axis of a sigma bond, akin to positioning your eye at the center of the bond. In this view, one carbon atom is represented in the foreground, while another is in the background, often depicted as a circle. This perspective allows for a detailed examination of how substituents on the front and back carbons are oriented relative to one another.
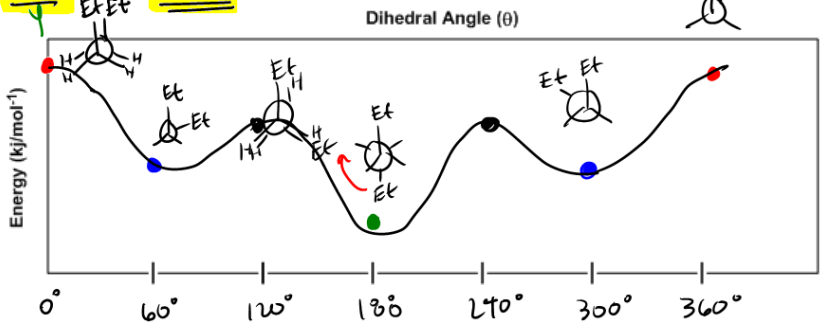
For instance, in a staggered conformation, larger groups, such as ethyl groups, are positioned on opposite sides of the carbon atoms, minimizing steric hindrance and resulting in a lower energy, more stable configuration. Conversely, in an eclipsed conformation, these larger groups overlap, leading to increased steric strain and higher energy, making the molecule less stable. This visualization technique is essential for understanding the stability of different conformations and the energy barriers associated with their interconversion.
In summary, Newman projections serve as a powerful tool for visualizing molecular conformations, allowing for a better understanding of the relationship between molecular structure and stability. By analyzing the spatial arrangement of substituents, one can predict the energy levels of various conformers, enhancing comprehension of molecular behavior in organic chemistry.